Market Insights Snapshot
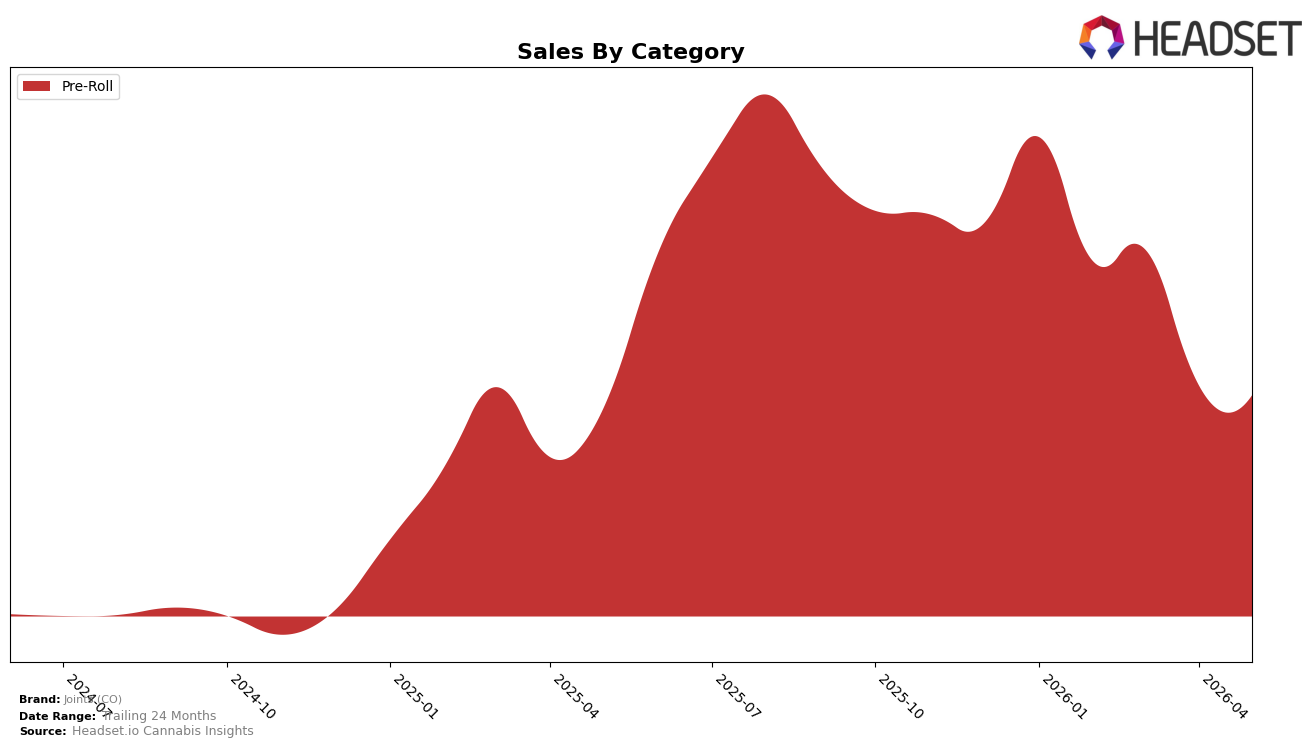
Joints (CO) operated as a single-category brand in May 2026, with Pre-Roll accounting for 100.0% of sales and an average price of $7.26, while year-over-year sales rose 6.21% and month-over-month sales fell 4.45%. Within Colorado Pre-Rolls, the brand sat at rank 26, pairing that placement with a 5.36% year-over-year decrease in average price and a 4.45% month-over-month sales decline; together these movements signal a reliance on price-led volume to sustain modest annual growth amid recent monthly softness.
The all-in Pre-Roll concentration and rank 26 position imply mid-tier visibility where a 6.21% year-over-year lift alongside a 5.36% price reduction suggests elasticity is working, but the 4.45% month-over-month dip indicates that short-cycle demand is sensitive to price floors and promotional cadence. The combination of a single-category footprint at 100.0% share and a May 2026 rank of 26 points to a need for either price stabilization or mix expansion within Pre-Roll formats to convert discount-driven gains into steadier month-to-month performance.
Competitive Landscape
Joints (CO) sits at rank #26 in Colorado Pre-Roll for May 2026, improving 9 positions year over year from #35 and falling 9 positions since February 2026 when it was #17; against its historical context, it remains 14 spots below its peak of #12 set in August 2025 and 23 places behind the current category leader. In contrast, Spectra advanced from #10 to #5 year over year alongside a 121.18% sales increase, while Seed & Strain Cannabis Co. moved from #5 to #4 with an 82.98% lift, indicating that faster-moving rivals are compressing the middle ranks; meanwhile, Cali-Blaze held #1 with 29.12% YoY growth, keeping distance from brands outside the top 20. The pattern implies Joints (CO)’s YoY climb masks recent quarter-over-quarter slippage, so without momentum reacceleration its trajectory points toward persistent mid-20s positioning rather than a return toward the #12 peak.

Notable Products
Loompa Breath Pre-Roll (1g) posted the standout move in May 2026 with a +60.9% month-over-month increase and a rise to rank 1, while Doobski - Violet Sunset Pre-Roll (1g) fell -53.4% and slid to rank 8, indicating a sharp reallocation of shopper attention within the lineup. Sour Diesel Pre-Roll (1g) advanced +29.9% and held rank 3 as Polar Fizz Pre-Roll (1g) declined -37.9% at rank 5, and nine of the top ten SKUs are Pre-Rolls, pointing to a concentrated portfolio leaning on a single format. The spread between the top performer at rank 1 and the declines at ranks 5, 8, and 10 (ranging from -37.9% to -53.4%) suggests demand is consolidating around a few hero SKUs rather than lifting the tier uniformly, with Loompa Breath generating $19,150 as evidence of that skew.
Top Selling Cannabis Brands
Data for this report comes from real-time sales reporting by participating cannabis retailers via their point-of-sale systems, which are linked up with Headset’s business intelligence software. Headset’s data is very reliable, as it comes digitally direct from our partner retailers. However, the potential does exist for misreporting in the instance of duplicates, incorrectly classified products, inaccurate entry of products into point-of-sale systems, or even simple human error at the point of purchase. Thus, there is a slight margin of error to consider. Brands listed on this page are ranked in the top twenty within the market and product category by total retail sales volume.

