.svg)

Aug-2026
Sales
Trend
6-Month
Product Count
SKUs
Avg Price
YoY Sales Change
YoY Price Change


Where to Buy
Jukebox is stocked at 25 licensed dispensaries across Arizona, with the deepest coverage in Tucson, Phoenix, Tempe, Chandler, and Scottsdale. Search by ZIP code or city below to find the closest one, or filter by product type if you are after a specific format.
Market Insights Snapshot
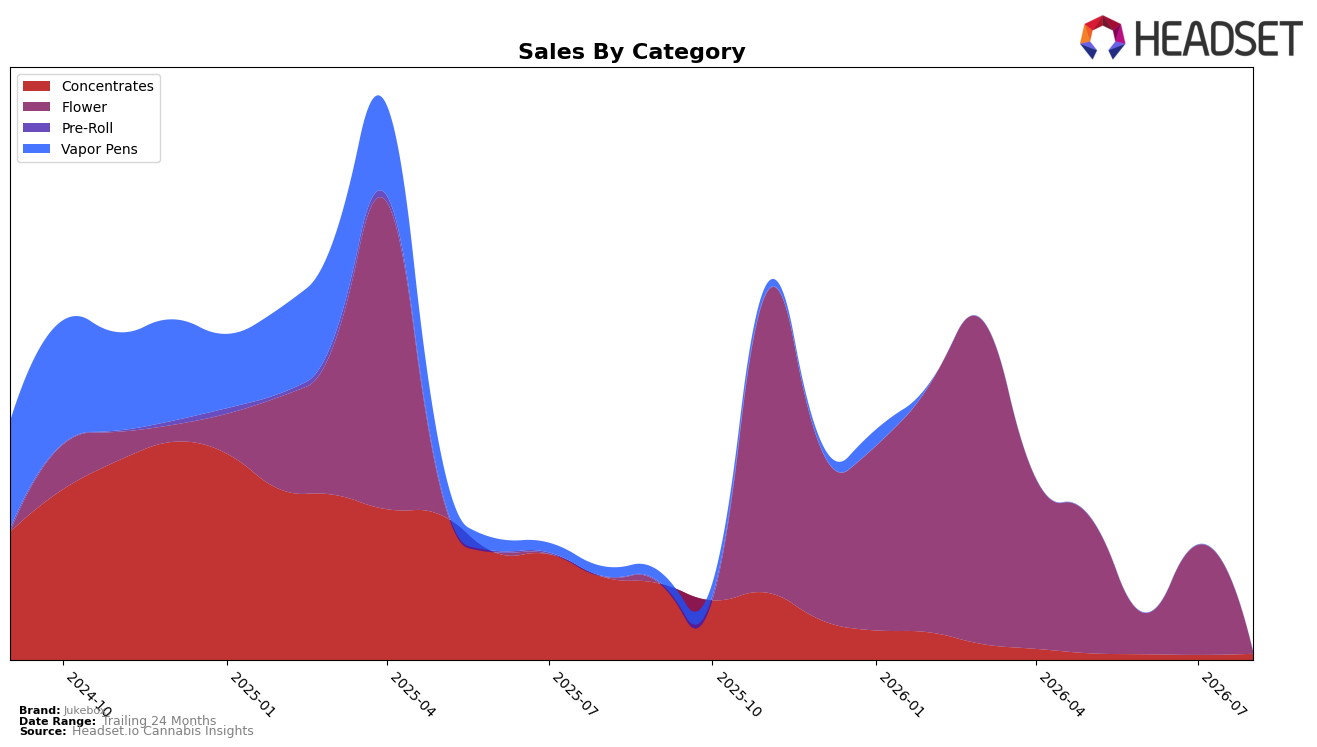
In August 2026, Jukebox’s mix pivoted heavily toward Concentrates at 76.70% share while Flower fell to 23.30% share, a reversal from prior months where Flower held the top spot. Concentrates posted a 22.86% month-over-month change alongside a -92.55% year-over-year decline, whereas Flower dropped -98.29% month-over-month with no year-over-year comp reported, aligning with a -91.33% brand sales year-over-year shift and a -13.13% average price change. The pattern indicates a consolidation into fewer, faster-turning SKUs in Concentrates while Flower volumes collapsed, implying the brand is trading mix volatility for short-term stability in its highest-velocity form factor.
The mix swing carries positioning implications: with Concentrates now over three times the share of Flower (76.70% vs. 23.30%) and brand sales down -96.90% over 24 months, Jukebox risks ceding Flower relevance while leaning into a lower-priced Concentrates strategy at an average price of $9.22. The absence of a Flower rank in Arizona combined with a -98.29% month-over-month Flower contraction suggests retail visibility has shifted away from Flower, while the +22.86% month-over-month in Concentrates provides the primary shelf signal. This implies Jukebox is repositioning toward a value-oriented Concentrates identity where price elasticity can recapture trips, even if it compresses category breadth and reduces optionality in Flower.
Competitive Landscape
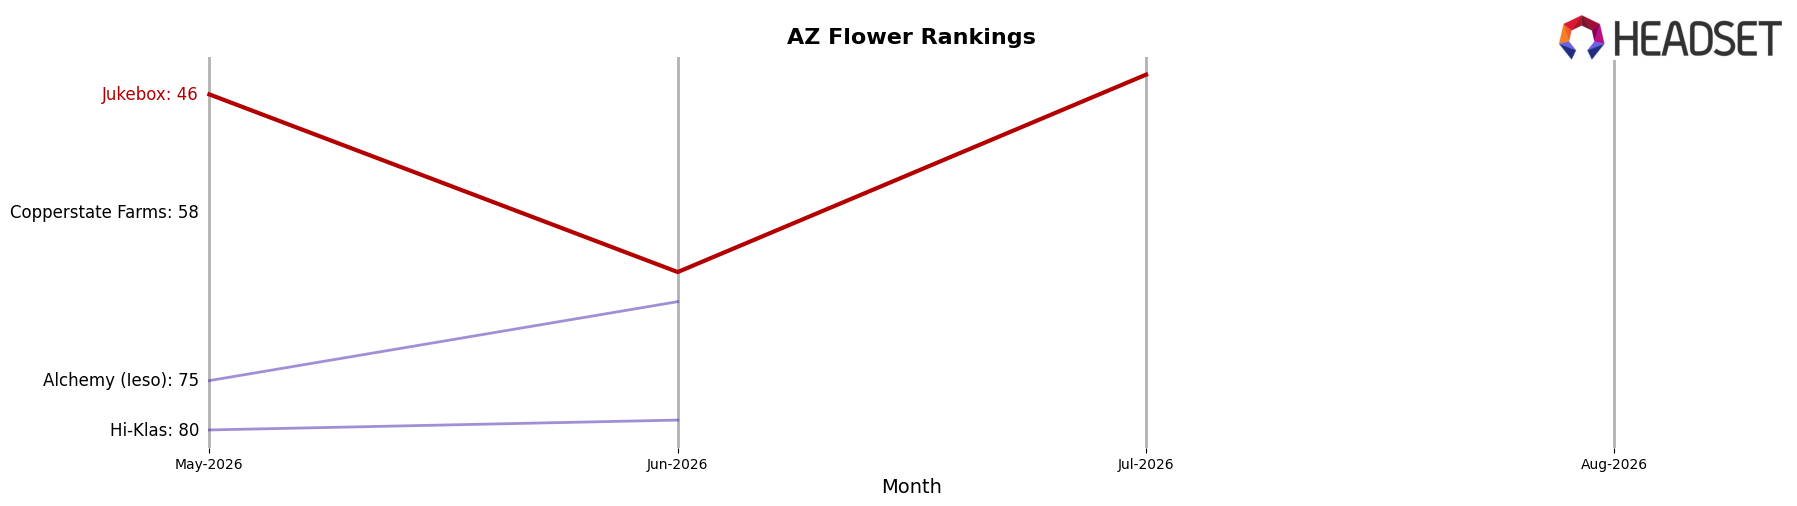
Jukebox sits at rank #85 in AZ Flower for August 2026, sliding 39 positions from #46 in May 2026 and sitting 55 places below its peak of #30 in March 2026; the three-month drop of 39 ranks contrasts with a current placement 84 spots behind category leader Just Flower at #1. Meanwhile, Find. rose to #2 from #3 year over year, and The Pharm climbed from #21 to #5 with 289.6% YoY sales growth, indicating competitors are moving up the table as Jukebox moves down; this divergence implies Jukebox’s rank trajectory points to declining shelf relevance unless the brand reverses the multi-month slide.
Notable Products
The Answer (3.5g) plunged 92.9997% month over month to rank 2 in August 2026, a collapse that contrasts with Gaschata #5 Shatter (1g) inching up 2.48% while holding rank 1, implying Flower volatility is dragging the ladder even as the lead Concentrate is stable. Concentrates occupy nine of the top ten positions in August 2026, with Gaschata #5 Shatter (1g) at rank 1 and Gastro Pop #4 Shatter (1g) at rank 5, and this concentration indicates the portfolio’s sell-through is anchored in extract formats rather than Flower. Gaschata #5 Shatter (1g) posted $1,939 alongside a 2.48% MoM uptick and rank 1, while Gastro Pop #4 Badder (1g) sat at rank 4 and Gastro Pop #4 Shatter (1g) at rank 5, signaling that sibling SKUs can occupy adjacent tiers without cannibalizing share. Net effect: Jukebox’s commercial direction is consolidating around Concentrates, with minimal upside from incremental MoM gains at the top but material downside risk concentrated in single-SKU Flower bets.
Top Selling Cannabis Brands






Data for this report comes from real-time sales reporting by participating cannabis retailers via their point-of-sale systems, which are linked up with Headset’s business intelligence software. Headset’s data is very reliable, as it comes digitally direct from our partner retailers. However, the potential does exist for misreporting in the instance of duplicates, incorrectly classified products, inaccurate entry of products into point-of-sale systems, or even simple human error at the point of purchase. Thus, there is a slight margin of error to consider. Brands listed on this page are ranked in the top twenty within the market and product category by total retail sales volume.

