.svg)

Sep-2026
Sales
Trend
6-Month
Product Count
SKUs
Avg Price
YoY Sales Change
YoY Price Change


Where to Buy
Tales & Travels is stocked at 109 licensed dispensaries across Illinois and Arkansas, 106 of them in Illinois, with the deepest coverage in Chicago, Quincy, Schaumburg, Joliet, and Villa Park. Search by ZIP code or city below to find the closest one, or filter by product type if you are after a specific format.
Market Insights Snapshot
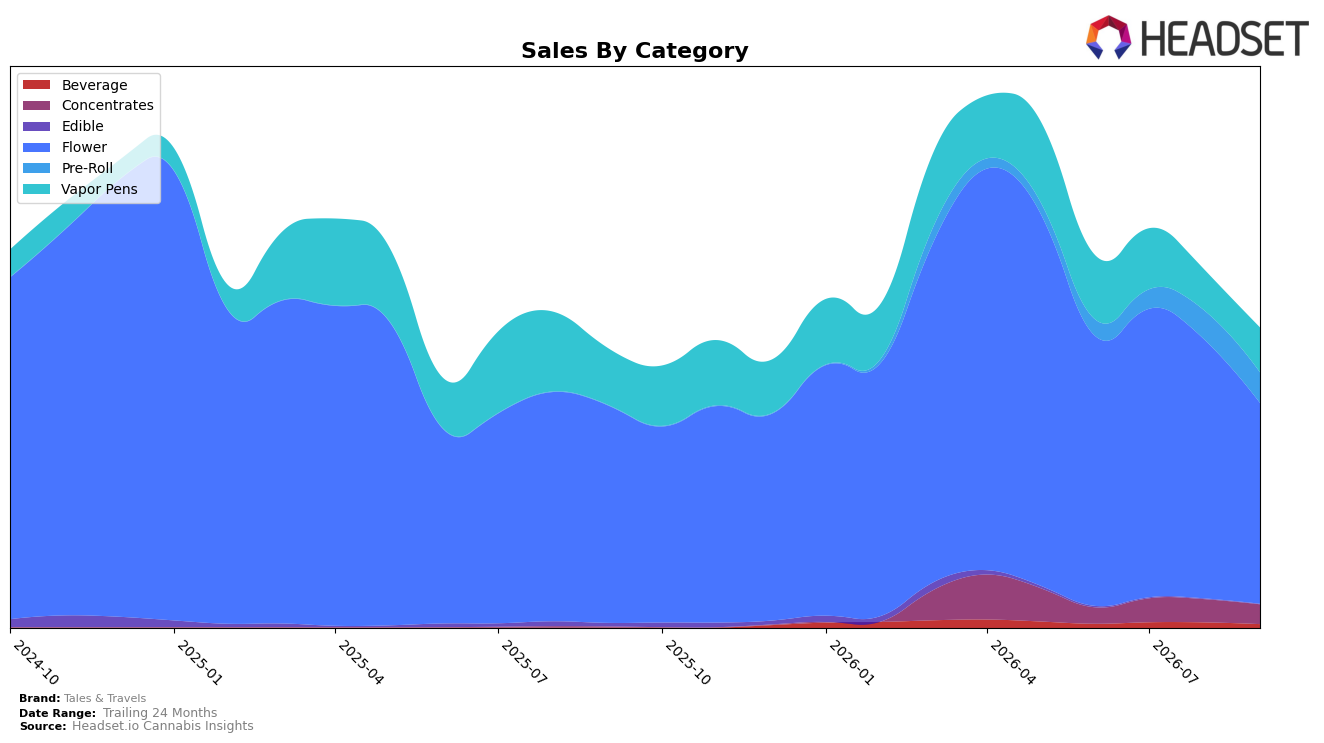
Tales & Travels concentrated 67.22% of September 2026 sales in Flower, down 22.37% month over month and 7.65% year over year, while its Flower rank in Illinois sat at 22, indicating mid-pack placement despite a brand-level sales increase of 7.50% YoY. Vapor Pens held 14.93% share with a 9.98% MoM lift but a 21.02% YoY decline, and Pre-Roll expanded to 10.13% share alongside a 5.07% MoM gain and an outsized 25,379.72% YoY jump off a negligible base; the average price across the brand fell 21.89% YoY to $33.02, suggesting mix and pricing pressure supporting unit velocity. These shifts imply the brand is migrating volume away from Flower into faster-moving formats while using lower prices and Pre-Roll availability to offset Flower contraction, a setup consistent with stabilizing rank in Flower but tilting growth toward accessory inhalables.
Concentrates reached 6.51% share with a 2,501.95% YoY surge but a 14.88% MoM pullback, while Beverage at 1.17% share dropped 33.26% MoM and Edible at 0.03% share contracted 70.47% MoM and 96.82% YoY, reinforcing a portfolio anchored in inhalables rather than ingestibles. With Flower weakening 22.37% MoM but Vapor Pens up 9.98% MoM and Pre-Roll up 5.07% MoM, the practical positioning is to lean into inhalable convenience formats to defend total sales, accepting lower average price points to widen the buyer base and treat Flower rank of 22 in Illinois as a traffic driver rather than the primary growth engine.
Competitive Landscape
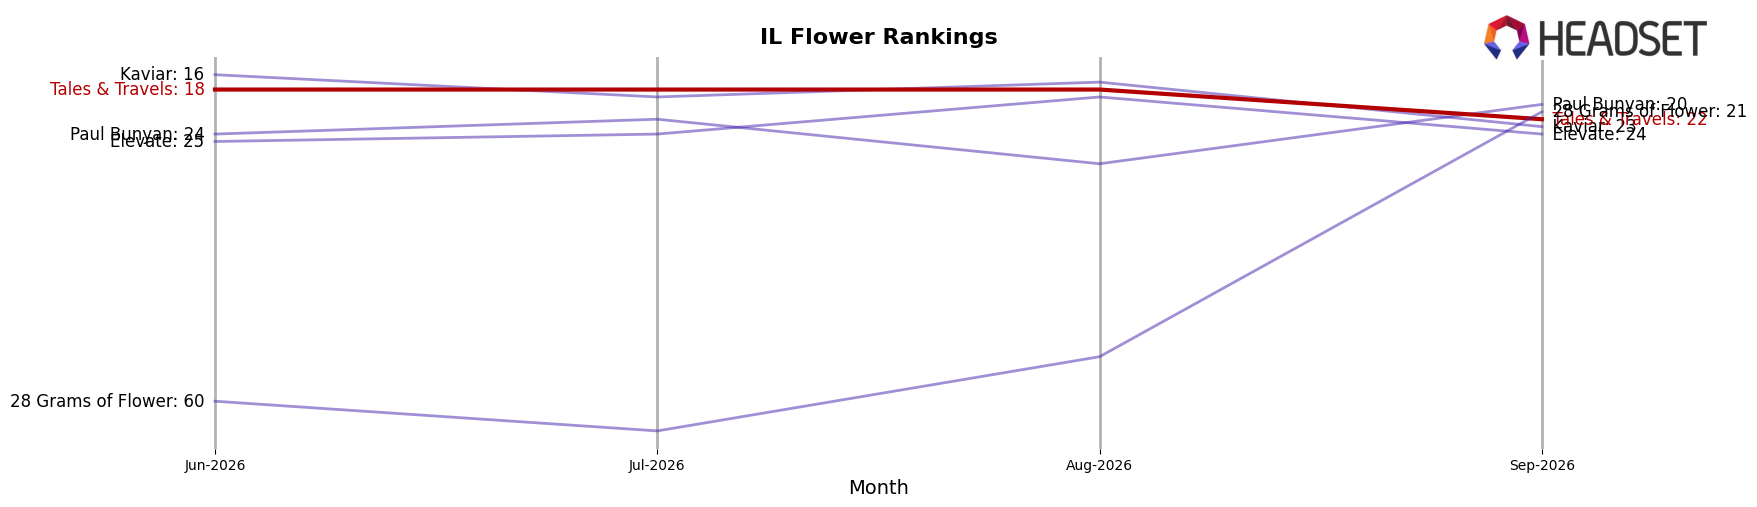
Tales & Travels sits at rank #22 in Illinois Flower in September 2026, down 1 position year over year from #21, and 4 places lower than its June 2026 position of #18, while also trailing its April 2026 peak of #11 by 11 ranks; in contrast, High Supply / Supply held at #1 year over year with a -2.5% sales change, and The Botanist surged from #27 to #4 alongside roughly +495% sales growth, indicating competitor ascent concentrated at the top slots. With RYTHM steady at #2 on +22.0% YoY sales and Good Green improving from #4 to #3 on +33.8% YoY sales while Daze Off slipped from #3 to #5 on -14.2% YoY sales, the brand’s slide from #18 three months ago to #22 now implies Tales & Travels is losing relative shelf momentum amid top-tier consolidation and mid-pack churn.
Notable Products
Mochi Runtz (3.5g) posted the steepest pullback in September 2026 with a -12.7% MoM drop while holding rank 4, and Raspberry Shortcake (3.5g) also contracted -22.9% yet remained rank 1, indicating volume leadership is concentrating despite softer momentum. Peach Crescendo (3.5g) rose +28.4% MoM to rank 2, narrowing the gap to the top spot, and Melonade (3.5g) added +10.0% at rank 6, with four of the top ten sitting in the Flower category to signal assortment weight is anchored in Flower rather than Pre-Rolls or Vapor Pens. The presence of Peach Crescendo (7g) at rank 10 alongside its 3.5g counterpart suggests multi-size laddering is working to capture different basket sizes, with only one raw-dollar standout near the middle of the pack at $43,203 (Peach Crescendo Popcorn 14g) pointing to potential trade-up into larger formats. Net effect: Tales & Travels is tilting toward a Peach Crescendo-led Flower portfolio where format breadth buffers single-SKU volatility, implying promo and inventory planning should prioritize scalable Flower variants over incremental Pre-Roll expansion.
Top Selling Cannabis Brands






Data for this report comes from real-time sales reporting by participating cannabis retailers via their point-of-sale systems, which are linked up with Headset’s business intelligence software. Headset’s data is very reliable, as it comes digitally direct from our partner retailers. However, the potential does exist for misreporting in the instance of duplicates, incorrectly classified products, inaccurate entry of products into point-of-sale systems, or even simple human error at the point of purchase. Thus, there is a slight margin of error to consider. Brands listed on this page are ranked in the top twenty within the market and product category by total retail sales volume.

