May-2026
Sales
Trend
6-Month
Product Count
SKUs
Avg Price
YoY Sales Change
YoY Price Change
Market Insights Snapshot
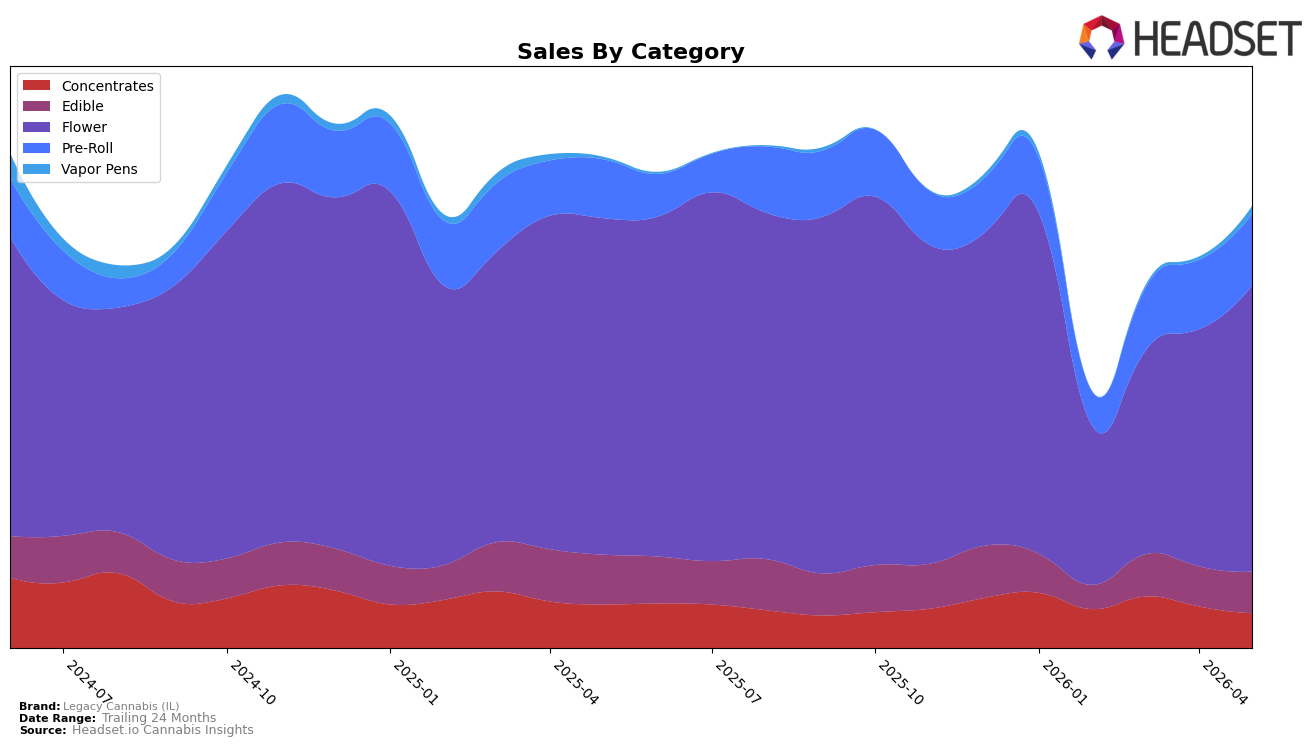
Legacy Cannabis (IL) concentrated 64.89% of May-2026 sales in Flower, where sales fell 15.1% year over year but rose 20.7% month over month, indicating a near-term rebound within a shrinking annual base; Pre-Roll held 16.18% share with 21.9% YoY growth and 3.1% MoM growth, while Edible at 9.40% share declined 16.3% YoY but edged up 3.8% MoM. Concentrates represented 7.82% share with a 20.3% YoY decline and a 16.7% MoM drop, and Vapor Pens, though just 1.71% share, spiked 233.8% YoY and 163.0% MoM; combined with a 22.9% YoY decrease in average price and a brand-level 10.1% YoY sales decline, the mix points to volume shifting toward lower-priced formats and selective momentum in value-driven inhalables. With Flower ranked 22nd in Illinois and remaining the core, the data imply tactical reweighting toward Pre-Roll and emerging Vapor Pens to offset pressure in Concentrates and stabilize the YoY drag.
The crosscurrents—Flower’s rank at 22 in Illinois and 20.7% MoM growth alongside a 15.1% YoY decline, plus Pre-Roll’s 21.9% YoY increase against Concentrates’ 20.3% YoY slide—suggest positioning that leans into accessible inhalables where price elasticity is favorable. The 233.8% YoY and 163.0% MoM surge in Vapor Pens, despite just 1.71% share, coupled with a 22.9% YoY average price drop and only a 3.1% MoM lift in Pre-Roll, implies that near-term share gains are most achievable by scaling low to mid-price inhalable SKUs while pruning underperforming Concentrates; the thesis is that sustaining MoM momentum without eroding mix requires balancing Flower depth with higher-velocity, lower-price-point line extensions.
Competitive Landscape
Legacy Cannabis (IL) sits at rank #22 in Illinois Flower in May 2026 with a 0-position YoY rank change (staying at #22) and a 9-rank climb from #31 three months ago, while its peak of #15 in September 2025 remains 7 positions higher than today; by comparison, High Supply / Supply holds #1 with a 29.8% YoY sales increase and RYTHM sits at #2 with a −12.2% YoY sales change, indicating Legacy’s stability amid leaders moving in opposite directions. The mix of lateral YoY rank (0 change) alongside a recent 9-position quarter-on-quarter rise implies Legacy Cannabis (IL) is recovering share tactically rather than expanding structurally, suggesting near-term gains are likely tied to short-cycle execution rather than a sustained march back toward its #15 peak.

Notable Products
Face on Fire (3.5g) posted the largest month-over-month gain at +60.9% and moved into rank 1, while Sweet Sweet (3.5g) fell -23.2% and slipped to rank 5; this split suggests consumer shift within Flower toward higher-velocity SKUs. Four of the top ten are Flower eighths, with LSD (3.5g) also down -20.8% at rank 7 alongside Permanent Marker (3.5g) up +33.1% at rank 6, indicating mix reallocation within the same category rather than category-level expansion. Edibles were mixed, with Cotton Candy Distillate Gummies 10-Pack (100mg) up +12.5% at rank 4 versus Litchi Bites Distillate Gummies 10-Pack (100mg) down -36.2% at rank 8 and total edible dollars near $19,700, implying flavor-specific traction rather than broad edible momentum. Overall, the pattern points to Legacy Cannabis (IL) leaning into a winner-take-most Flower lineup while treating Edibles as a selective, flavor-led support pillar.
Top Selling Cannabis Brands
Data for this report comes from real-time sales reporting by participating cannabis retailers via their point-of-sale systems, which are linked up with Headset’s business intelligence software. Headset’s data is very reliable, as it comes digitally direct from our partner retailers. However, the potential does exist for misreporting in the instance of duplicates, incorrectly classified products, inaccurate entry of products into point-of-sale systems, or even simple human error at the point of purchase. Thus, there is a slight margin of error to consider. Brands listed on this page are ranked in the top twenty within the market and product category by total retail sales volume.

