Market Insights Snapshot
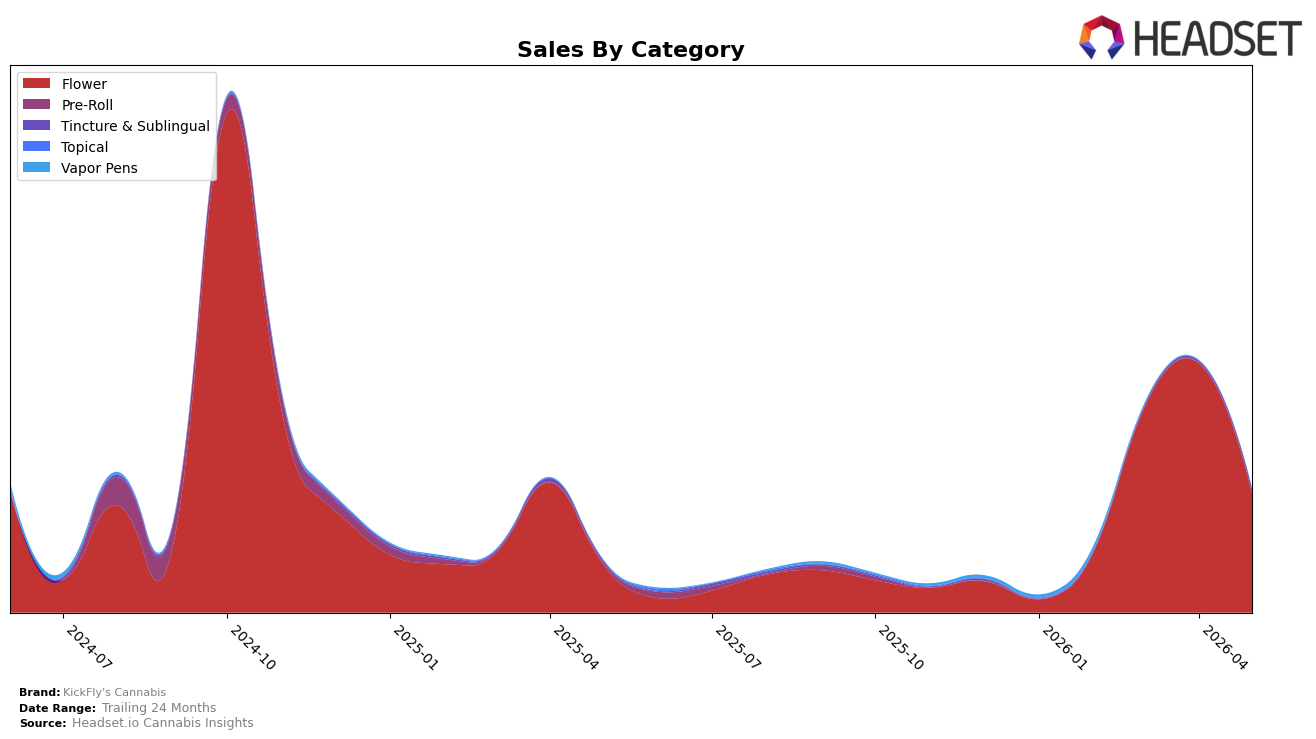
KickFly's Cannabis concentrated 96.84% of May 2026 sales in Flower, with Tincture & Sublingual at 3.16%, signaling a skewed mix that moved despite divergent momentum. Flower grew 150.43% year over year while dropping 52.27% month over month, whereas Tincture & Sublingual climbed 174.48% year over year and rose 135.71% month over month, indicating a sharp intra-month pivot. The brand’s average price fell 31.57% year over year to $30.67 as Flower averaged 30.28 and Tincture & Sublingual averaged 50.66, a price spread that coincided with a 142.12% brand-level year-over-year sales increase alongside a 17.07% decline over 24 months. The implication is that heavy reliance on Flower drove year-over-year scale while the month-over-month contraction points to volatility that the fast-growing Tincture & Sublingual can partially buffer.
Mix shifts suggest positioning is anchored in value-accessible Flower while testing higher-ticket Tincture & Sublingual as a secondary growth lever. The 52.27% month-over-month decline in Flower against a 135.71% month-over-month lift in Tincture & Sublingual implies short-term demand or supply sensitivity in the core balanced by a niche that can absorb swings, and the 150.43% versus 174.48% year-over-year growth gap shows white space beyond Flower even at just 3.16% share. With the top state flagged as New York and the top category as Flower, the downward 24-month sales trend of 17.07% juxtaposed with a 31.57% price decrease implies price-led acquisition that risks concentration risk unless Tincture & Sublingual scales from a small base.
Competitive Landscape
KickFly's Cannabis sits at rank #139 in May 2026, improving 42 positions from #181 year over year, while also rising 38 spots from #177 since February 2026; by contrast, Leal climbed from #11 to #1 with 109.1% YoY sales growth and RYTHM moved from #10 to #4 alongside a 45.7% YoY lift, indicating KickFly's relative gains are lagging top-tier momentum despite a rebound from its October 2024 peak of #42. The gap from #42 at peak to #139 now, paired with competitors consolidating in the top 5 (e.g., Dank. By Definition sliding from #1 to #2 with a 38.1% YoY sales decline while still maintaining a top-2 slot), signals that KickFly's trajectory is recovery rather than leadership, implying the brand must convert rank stabilization into share capture before top-tier positions harden.

Notable Products
Grape Gas x Blackscotti (3.5g) posted the steepest contraction in May 2026 with a -59.4% month-over-month change while sliding to rank 2, and El Chlvo (3.5g) also declined -32.8% yet held rank 1. Fumez (3.5g) fell -44.6% at rank 3, and Mule Fuel (3.5g) dropped -47.3% at rank 4, indicating that four of the top four SKUs saw double-digit pullbacks as value-sized 14g entries like Cookie Dream (14g) and Cake Code (14g) moved into ranks 5 and 6. With Flower accounting for all top-10 placements and one 14g SKU generating $6,738, the mix points to a pivot toward larger pack sizes buffering rank stability amid shrinking 3.5g velocities.
Top Selling Cannabis Brands
Data for this report comes from real-time sales reporting by participating cannabis retailers via their point-of-sale systems, which are linked up with Headset’s business intelligence software. Headset’s data is very reliable, as it comes digitally direct from our partner retailers. However, the potential does exist for misreporting in the instance of duplicates, incorrectly classified products, inaccurate entry of products into point-of-sale systems, or even simple human error at the point of purchase. Thus, there is a slight margin of error to consider. Brands listed on this page are ranked in the top twenty within the market and product category by total retail sales volume.

