Jun-2026
Sales
Trend
6-Month
Product Count
SKUs
Avg Price
YoY Sales Change
YoY Price Change
Market Insights Snapshot
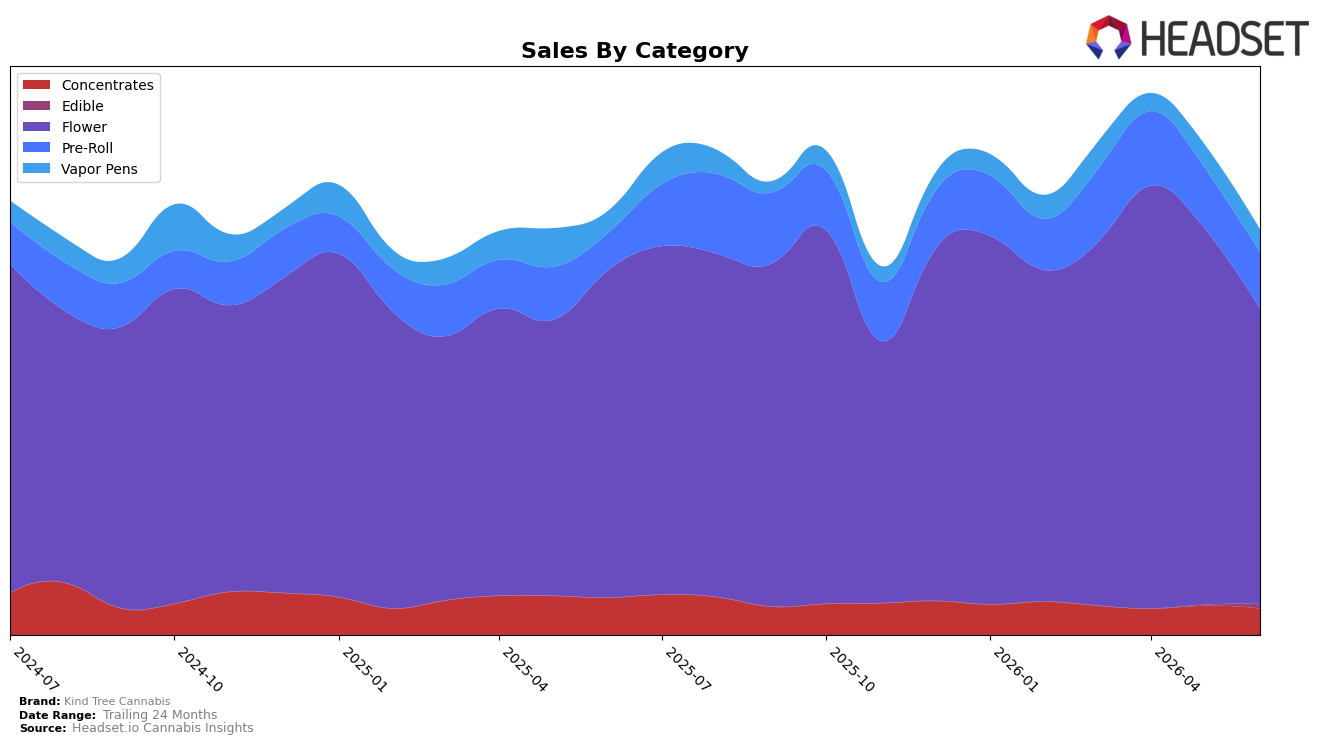
In June 2026, Kind Tree Cannabis concentrated 73.02% of sales in Flower, where sales fell 9.77% year over year and 21.56% month over month, while rank in Flower sat at 9 in New Jersey and average brand price declined 2.24% YoY. Counterbalancing, Pre-Roll lifted 52.07% YoY to 13.93% share but slipped 7.22% MoM, and Vapor Pens inched up 2.30% YoY at 5.55% share with a 1.03% MoM dip; meanwhile, Concentrates contracted 29.24% YoY and 9.75% MoM to 6.46% share, and Edible expanded 497.93% MoM to 1.04% share off a small base. The pattern implies overexposure to Flower is amplifying overall volatility and dragging total performance, while emerging growth in Pre-Roll and stability in Vapor Pens provide partial insulation if mix rebalances further.
With overall brand sales down 4.43% YoY and a 11.62% two-year decline, a 73.02% Flower dependency alongside a rank of 9 in New Jersey signals that marginal share shifts within Flower can outweigh the 52.07% YoY lift in Pre-Roll or the 2.30% YoY gain in Vapor Pens. The 497.93% MoM spike in Edible at a 1.04% share and the 7.22% MoM pullback in Pre-Roll indicate that near-term momentum is fragmented, suggesting the path to steadier positioning lies in nudging mix away from the 21.56% MoM Flower drop and toward categories with steadier MoM trajectories, even if their YoY baselines differ.
Competitive Landscape
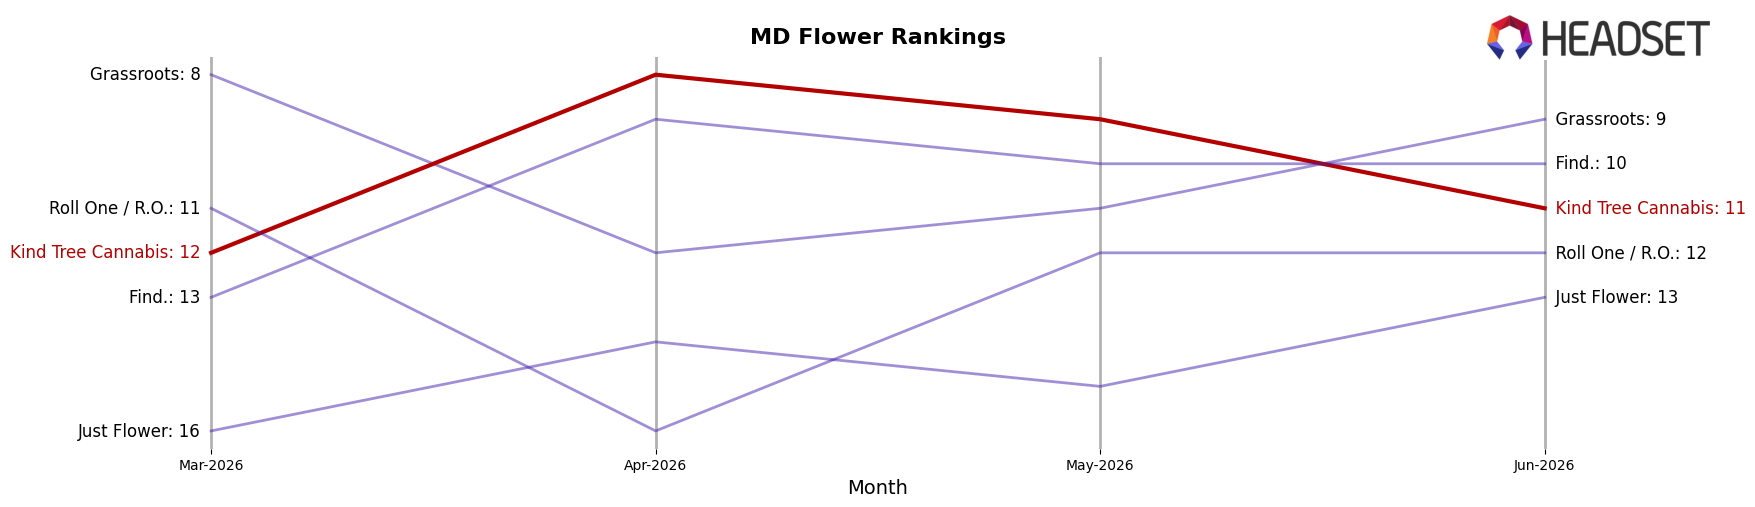
Kind Tree Cannabis sits at rank #11 in MD Flower in June 2026, improving 5 positions year over year from #16, but slipping 3 spots from its April 2026 peak at #8 to #11, which suggests momentum cooled after a late-spring high. Meanwhile, SunMed held #1 with a 0-position YoY change and 13.4% YoY sales growth, and RYTHM advanced from #3 to #2 with 42.7% YoY growth, outpacing Kind Tree Cannabis’s rank gains; Strane moved from #7 to #4 with 58.8% YoY growth, indicating that competitors converting growth into rank shifts faster than Kind Tree Cannabis are compressing mid-tier mobility. The pattern implies Kind Tree Cannabis’s YoY climb is real but its quarter-to-date giveback (from #12 in March 2026 to #11 in June 2026 while peers jumped multiple ranks) points to a need for a sharper mix or distribution push to sustain a top-10 foothold.
Notable Products
Grape Sitter (3.5g) posted the steepest decline in June 2026 at -29.7% and slid to rank 9, while Cherry Slushee (3.5g) fell -27.1% yet held rank 2, signaling demand compression at both the tail and the top. White Iverson (3.5g) stayed at rank 1 despite a -21.3% month-over-month drop, and Ice Cream Banger (3.5g) was the only upward mover in the top four with +16.6% at rank 3, indicating share is consolidating around fewer resilient Flower SKUs. Eight of the top ten are Flower products and two are Pre-Rolls, and the presence of two Pre-Roll 2-Packs in ranks 5 and 6 suggests a budding value-oriented format alongside premium eighths with a single raw sales anchor near $167,000 at the top. The pattern implies Kind Tree Cannabis is leaning into a Flower-led portfolio where occasional single-SKU gains must offset broad softness, with Pre-Rolls emerging as a hedge to stabilize velocity.
Top Selling Cannabis Brands
Data for this report comes from real-time sales reporting by participating cannabis retailers via their point-of-sale systems, which are linked up with Headset’s business intelligence software. Headset’s data is very reliable, as it comes digitally direct from our partner retailers. However, the potential does exist for misreporting in the instance of duplicates, incorrectly classified products, inaccurate entry of products into point-of-sale systems, or even simple human error at the point of purchase. Thus, there is a slight margin of error to consider. Brands listed on this page are ranked in the top twenty within the market and product category by total retail sales volume.

