Jun-2026
Sales
Trend
6-Month
Product Count
SKUs
Avg Price
YoY Sales Change
YoY Price Change
Market Insights Snapshot
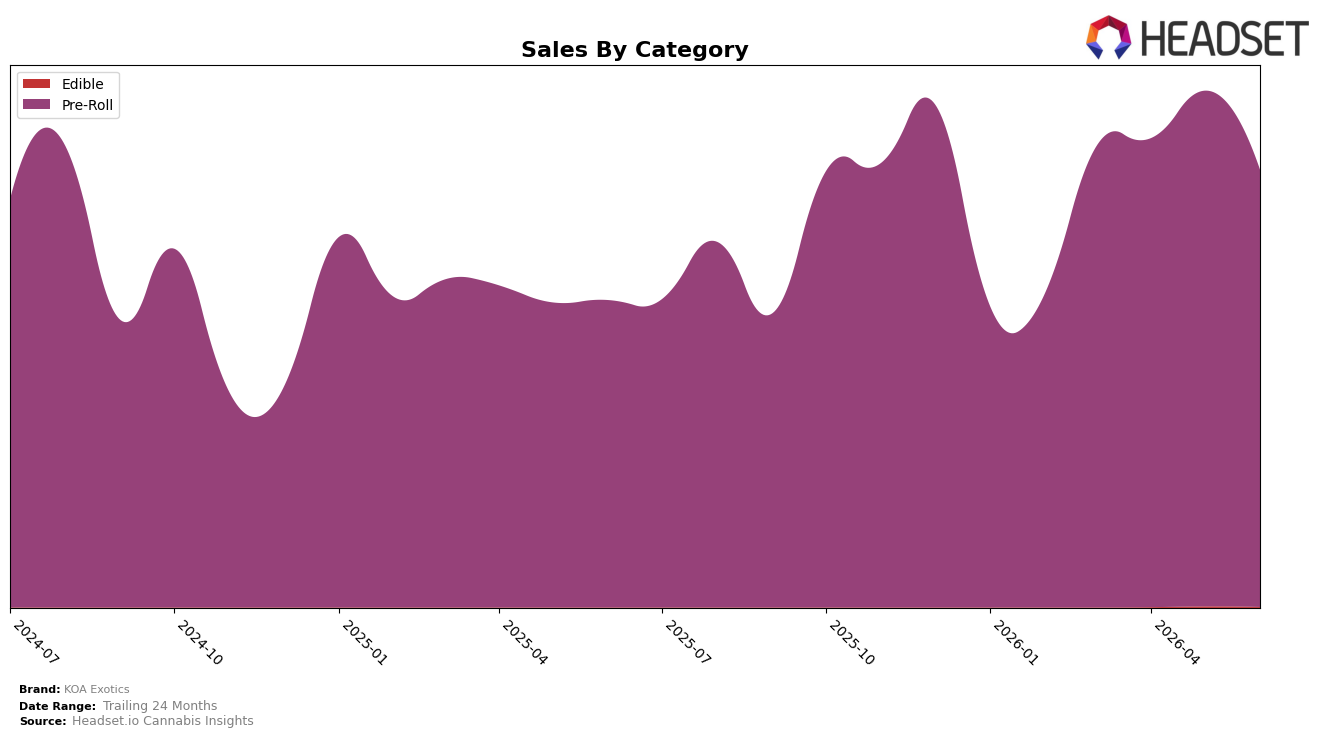
KOA Exotics concentrated 99.89% of June 2026 sales in Pre-Roll, with Edible at 0.11% share, while Pre-Roll grew 42.36% year over year but fell 15.22% month over month; Edible declined 53.54% month over month with no year-over-year baseline. Average price dropped 12.83% year over year to $35.25 alongside brand-level sales growth of 42.51%, and Pre-Roll’s average price sat at 35.43, indicating mix stability even as monthly volume softened. With a Pre-Roll rank of 23 in New York during June 2026 and a 24‑month sales increase of 41.92%, the pattern implies a price-led scale strategy centered on a single category where monthly volatility is absorbed by wider-year gains.
The shift toward a near-pure Pre-Roll mix (up 42.36% YoY but down 15.22% MoM) combined with a 12.83% YoY price reduction indicates KOA Exotics is trading lower unit pricing for share elasticity, positioning as a volume-driven Pre-Roll player rather than a diversified portfolio. Edible’s 0.11% share and 53.54% MoM decline suggest limited cross-category insulation, so rank 23 in New York relies on sustaining Pre-Roll throughput despite monthly pullbacks; the implication is that maintaining or improving rank will depend on converting the YoY demand surge into repeatable monthly velocity at the current price tier.
Competitive Landscape
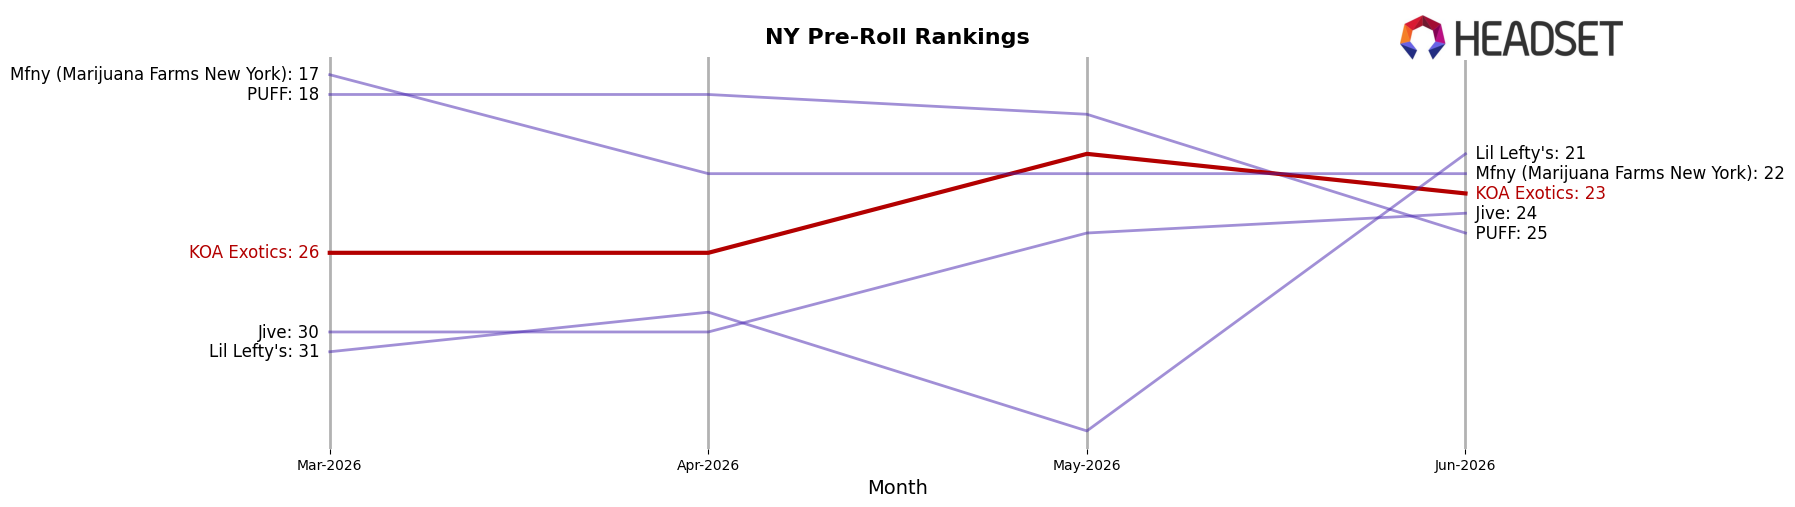
KOA Exotics ranks #23 in New York Pre-Roll in June 2026, improving 2 positions from #25 year over year, and edging up 3 positions from #26 in March 2026, while sitting 2 spots below its peak of #21 reached in May 2026; in contrast, Ruby Farms held #1 with a 15.6% year-over-year sales increase and Anthem vaulted from #40 to #3 alongside an 852.1% year-over-year sales surge, indicating KOA Exotics’ gradual rank gains are occurring amid faster upward mobility at the top end and implying a trajectory that preserves mid-pack relevance unless conversion accelerates beyond incremental rank changes.
Notable Products
The steepest decline came from Captain Crunch Live Resin Infused Pre-Roll 10-Pack (3.5g), which fell 23.4% month over month to rank 4 while Illuminati OG x Skywalker Live Resin Infused Pre-Roll 10-Pack (3.5g) dropped 40.7% to rank 3. Despite these pullbacks, Green Crack x Lemon Haze Live Resin Infused Pre-Roll 10-Pack (3.5g) held rank 1 and Blue Dream Infused Pre-Roll 10-Pack (3.5g) slipped 8.6% at rank 5, indicating demand is consolidating at the very top. Nine of the top ten SKUs are in the Pre-Roll category and multiple entries are Live Resin Infused 10-Packs, concentrating share in a single format while exposing volatility in mid-pack positions. This pattern implies KOA Exotics is leaning into a narrow pre-roll portfolio where leadership SKUs anchor volume but mid-tier variants will need pruning or repositioning to stabilize month-to-month swings.
Top Selling Cannabis Brands
Data for this report comes from real-time sales reporting by participating cannabis retailers via their point-of-sale systems, which are linked up with Headset’s business intelligence software. Headset’s data is very reliable, as it comes digitally direct from our partner retailers. However, the potential does exist for misreporting in the instance of duplicates, incorrectly classified products, inaccurate entry of products into point-of-sale systems, or even simple human error at the point of purchase. Thus, there is a slight margin of error to consider. Brands listed on this page are ranked in the top twenty within the market and product category by total retail sales volume.

