Market Insights Snapshot
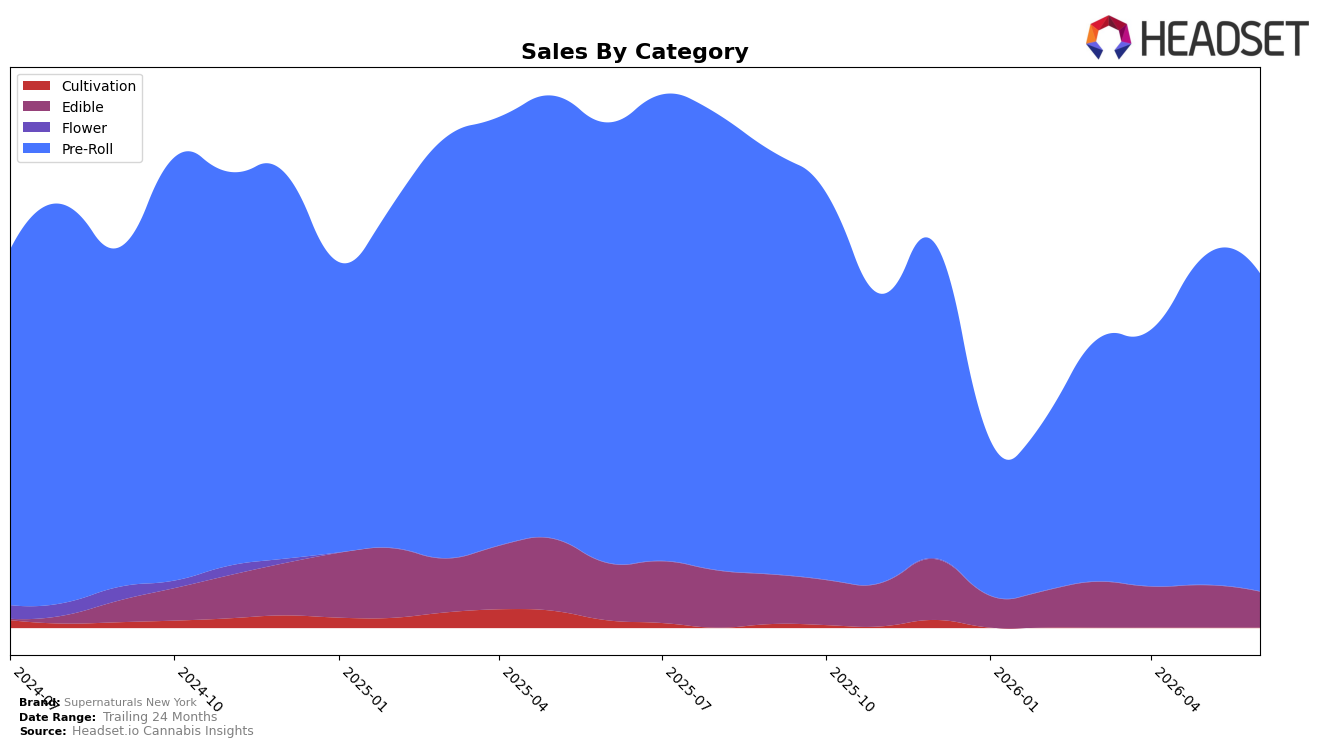
Pre-Roll drove 89.9% share in June 2026, down 3.3% month over month and 27.8% year over year, while Edible held 10.1% share with a sharper 15.4% MoM and 37.2% YoY decline; together these moves align with a 28.9% YoY sales contraction and a 10.3% YoY drop in average price to $23.78. In New York, Supernaturals New York sat at rank 27 in Pre-Roll, indicating a mid-pack position even as category concentration rose, implying the brand’s reliance on a single category increased as both categories declined at different velocities.
The widening gap between a heavily weighted Pre-Roll mix (89.9%) and faster-falling Edibles (-15.4% MoM versus -3.3% MoM for Pre-Roll) suggests price-driven defense in the core while secondary formats lose traction more quickly; this mix skew likely pressures visibility because rank 27 in Pre-Roll limits discovery leverage when overall sell-through is soft. The combination of a 10.3% YoY price decline and a 27.8% YoY Pre-Roll volume contraction points to discounting insufficient to offset demand headwinds, implying that Supernaturals New York needs assortment depth beyond Pre-Roll to stabilize share without further price reliance.
Competitive Landscape
Supernaturals New York sits at rank #27 in NY Pre-Roll for June 2026, down 12 positions from #15 in June 2025, while improving 5 spots from #32 in March 2026; compared with competitors, Ruby Farms held at #1 year over year and Anthem surged from #40 to #3. The brand’s current #27 contrasts with its peak of #8 in June 2024, and its June 2026 standing trails Jetpacks at #5 despite Jetpacks posting a -8.64% sales change year over year; by rank momentum, Supernaturals New York’s three-month climb of 5 places is outweighed by a 12-place decline year over year, implying the trajectory has shifted from recovery to longer-term share erosion unless recent quarterly gains compound.

Notable Products
CBD/THC 1:1 Lifter Pre-Roll 2-Pack (1.5g) posted the steepest decline at -18.5% and slipped to rank 5, while Galactica Pre-Roll 2-Pack (1.5g) gained 20.8% to hold rank 2. Cast Iron Cake Pre-Roll 5-Pack (3.5g) rose 14.9% at rank 1, whereas Purple Mandy Pre-Roll 5-Pack (3.5g) in a parallel rank 1 position advanced just 3.0%. With eight of the top ten SKUs in the Pre-Roll category and only one Edible at rank 9, the mix implies Supernaturals New York is concentrating on multi-pack inhalables to drive June 2026 volume, even as a key balanced-CBD SKU weakens.
Top Selling Cannabis Brands
Data for this report comes from real-time sales reporting by participating cannabis retailers via their point-of-sale systems, which are linked up with Headset’s business intelligence software. Headset’s data is very reliable, as it comes digitally direct from our partner retailers. However, the potential does exist for misreporting in the instance of duplicates, incorrectly classified products, inaccurate entry of products into point-of-sale systems, or even simple human error at the point of purchase. Thus, there is a slight margin of error to consider. Brands listed on this page are ranked in the top twenty within the market and product category by total retail sales volume.

