May-2026
Sales
Trend
6-Month
Product Count
SKUs
Avg Price
YoY Sales Change
YoY Price Change
Market Insights Snapshot
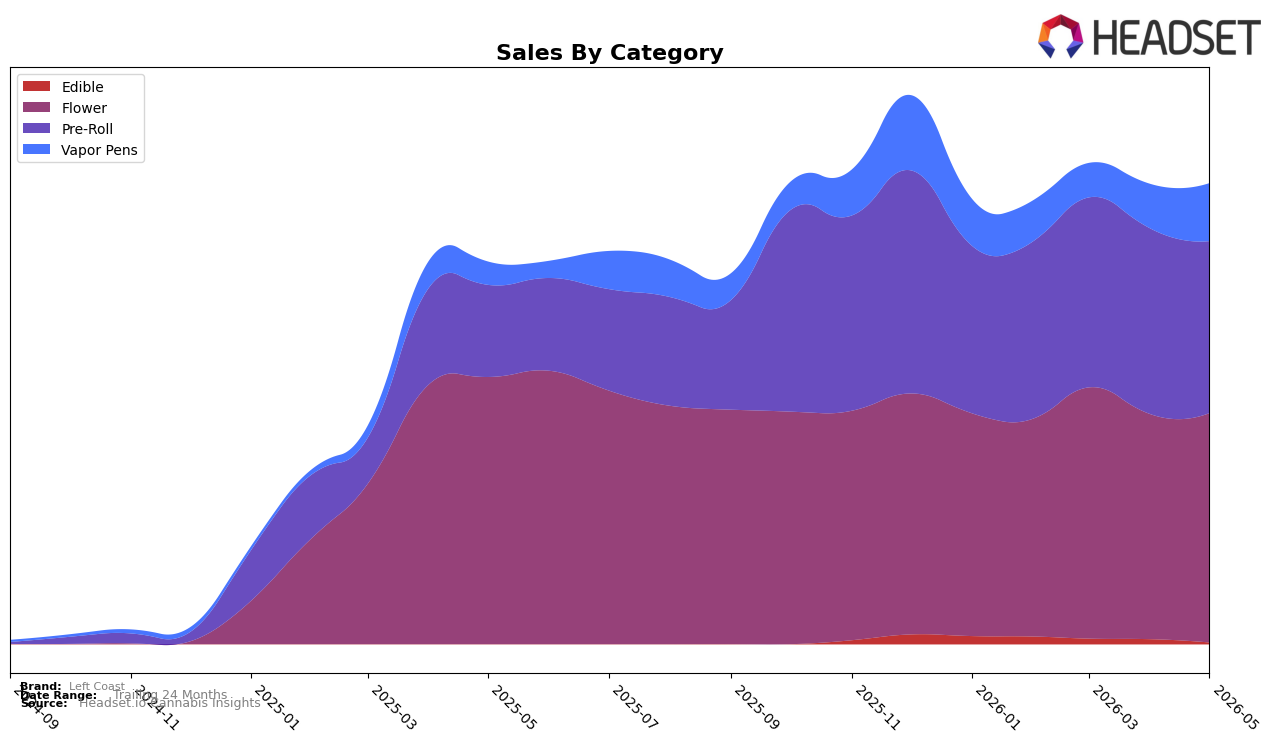
In May 2026, Left Coast’s mix tilted toward Flower at 49.77% share despite a year-over-year decline of 14.18% and a month-over-month uptick of 1.89%, while Pre-Roll held 37.30% share with an 86.94% year-over-year surge but a 7.40% month-over-month pullback. Vapor Pens expanded to 12.55% share with 150.49% year-over-year growth and a 30.39% month-over-month increase, whereas Edible contracted to 0.37% share with a 65.71% month-over-month drop. With Flower ranked 38th in New York and the brand’s average price down 15.52% year over year to $38.93, the pattern implies a shift from a Flower-heavy base toward faster-growing inhalables as price repositioning lowers barriers in Pre-Roll and Vapor Pens.
The simultaneous 86.94% year-over-year expansion in Pre-Roll and 150.49% year-over-year expansion in Vapor Pens, alongside a 14.18% year-over-year Flower decline, implies that Left Coast is trading mix into formats with higher velocity and promotional elasticity rather than defending share solely through Flower rank 38 in New York. The 7.40% month-over-month contraction in Pre-Roll versus a 30.39% month-over-month gain in Vapor Pens suggests recent consumer switching within inhalables, and the 1.89% month-over-month lift in Flower paired with a 65.71% month-over-month drop in Edible implies the portfolio is concentrating on inhalable convenience tiers; taken together, the brand is positioning around price-accessible, quick-turn SKUs to compound the 20.54% brand-level year-over-year growth despite pressure in legacy Flower.
Competitive Landscape
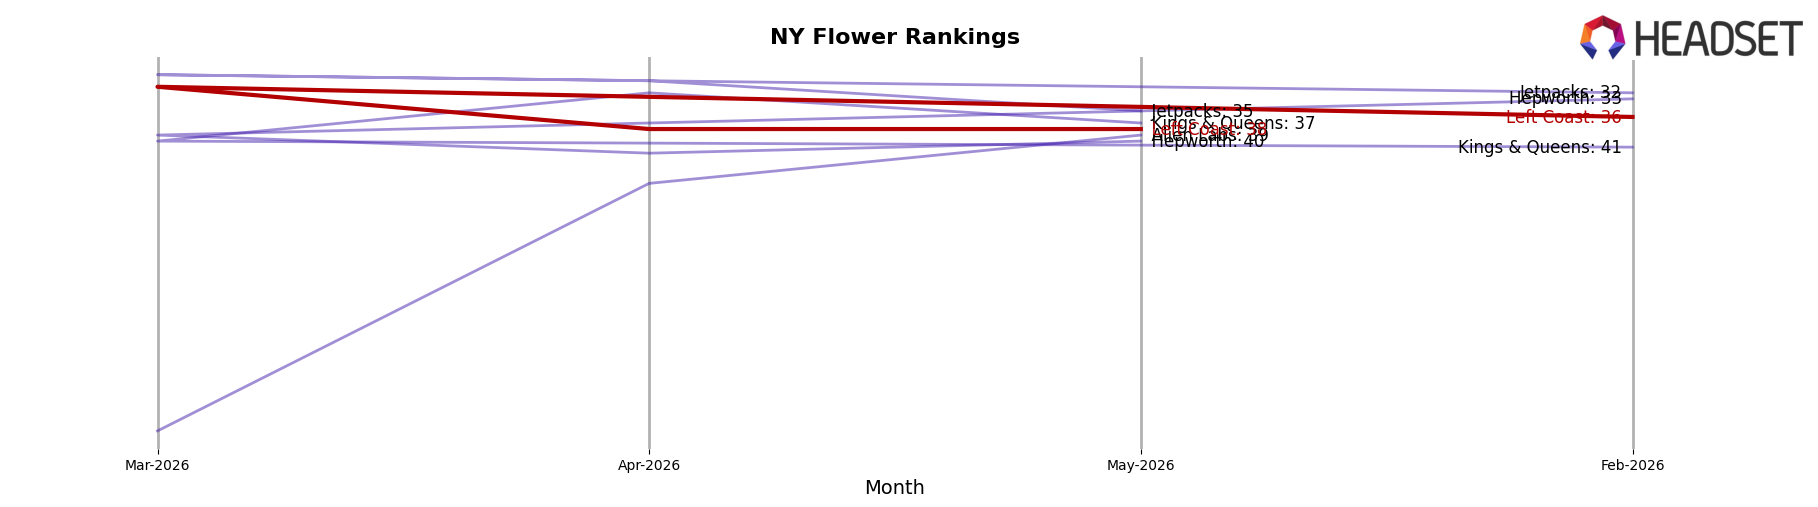
Left Coast sits at rank 38 in New York Flower for May 2026, down 12 positions year over year from rank 26, and it slipped 2 spots from rank 36 in February 2026 to rank 38 in May 2026; against that backdrop, Leal climbed from rank 11 to rank 1 with 109.3% year-over-year sales growth while Dank. By Definition fell from rank 1 to rank 2 with a 38.1% sales decline, indicating that leadership churn is benefiting competitors with momentum. With Left Coast’s peak at rank 26 in May 2025 and a current placement 12 ranks lower, while RYTHM advanced from rank 10 to rank 4 alongside 45.8% sales growth and Rolling Green Cannabis eased from rank 2 to rank 3 with a 13.0% sales decline, the pattern implies Left Coast is losing relative shelf consideration as faster-moving rivals reorder the top tier.
Notable Products
Orange Creamsicle Liquid Diamond Infused & Kief Coated Infused Pre-Roll 5-Pack (3.75g) slid to rank 3 with a -11.4% month-over-month change, while Sour Diesel (3.5g) held rank 1 despite a steeper -22.1% decline, indicating pressure at both the flagship and a key pre-roll. Divorce Cake Infused Pre-Ground (7g) countered with a +38.6% lift at rank 2 and captured the only large positive move among the top five, as Blue Dream (3.5g) in rank 4 advanced by +9.1% and Lil Leftys - Grape Cookies Infused Pre-Roll 5-Pack (3.75g) at rank 5 dipped -7.4%. Four of the top ten are Pre-Roll SKUs, but three of those posted negative or null momentum, contrasting with multiple Flower entries in the top six showing stability or gains and concentrating revenue toward infused ground formats; the mix points to a pivot toward infused Flower-led value at scale, with pre-rolls serving as tactical, not primary, drivers.
Top Selling Cannabis Brands
Data for this report comes from real-time sales reporting by participating cannabis retailers via their point-of-sale systems, which are linked up with Headset’s business intelligence software. Headset’s data is very reliable, as it comes digitally direct from our partner retailers. However, the potential does exist for misreporting in the instance of duplicates, incorrectly classified products, inaccurate entry of products into point-of-sale systems, or even simple human error at the point of purchase. Thus, there is a slight margin of error to consider. Brands listed on this page are ranked in the top twenty within the market and product category by total retail sales volume.

