.svg)

Aug-2026
Sales
Trend
6-Month
Product Count
SKUs
Avg Price
YoY Sales Change
YoY Price Change


Where to Buy
Kusala Care is stocked at 25 licensed dispensaries across New Jersey, with the deepest coverage in Atlantic City, Blackwood, Buena, Butler, and Clementon. Search by ZIP code or city below to find the closest one, or filter by product type if you are after a specific format.
Market Insights Snapshot
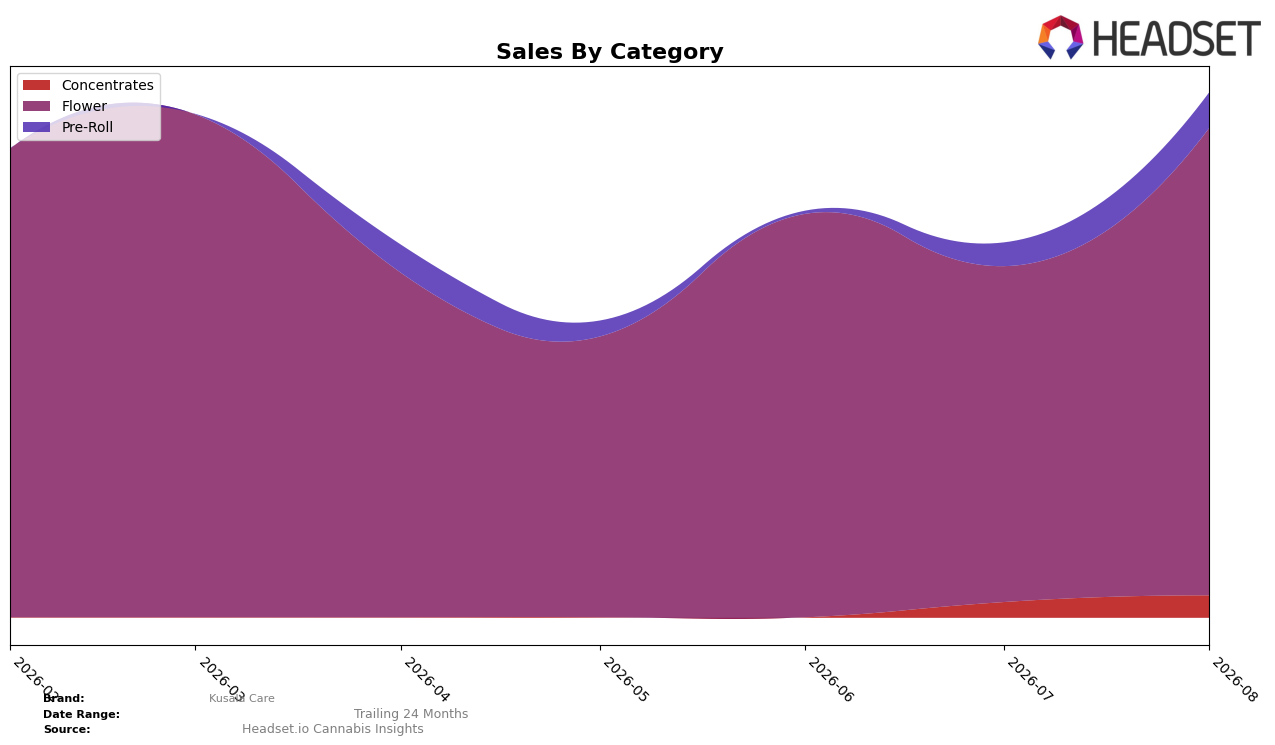
Kusala Care concentrated 89.08% of August 2026 sales in Flower, with Pre-Roll at 6.72% and Concentrates at 4.20%, and the month-over-month shifts were uneven: Flower rose 39.15%, Pre-Roll jumped 51.28%, and Concentrates advanced 43.91%. Average prices diverged by category, with Flower at $52.14 and Concentrates at $45.82, implying a mix-led lift even as Pre-Roll maintained a lower $31.80 price point; anchored by a Flower rank of 52 in New Jersey, the pattern implies that outsized gains in smaller formats are beginning to rebalance reliance on a single category despite Flower’s dominant share and mid-pack placement.
The acceleration in Pre-Roll (51.28% MoM) and Concentrates (43.91% MoM), versus Flower’s 39.15% MoM, suggests incremental share could shift away from Flower’s 89.08% toward the 6.72%–4.20% niches if the growth gap persists across September 2026 and October 2026. With a $52.14 Flower price versus a $31.80 Pre-Roll price and a $45.82 Concentrates price, margin mix risk rises if faster growth skews to lower-priced units, while a rank of 52 in Flower in New Jersey anchors the brand’s visibility; this combination implies a positioning decision between defending Flower share to climb ranks or leaning into faster-growing, lower-priced formats to broaden reach.
Competitive Landscape
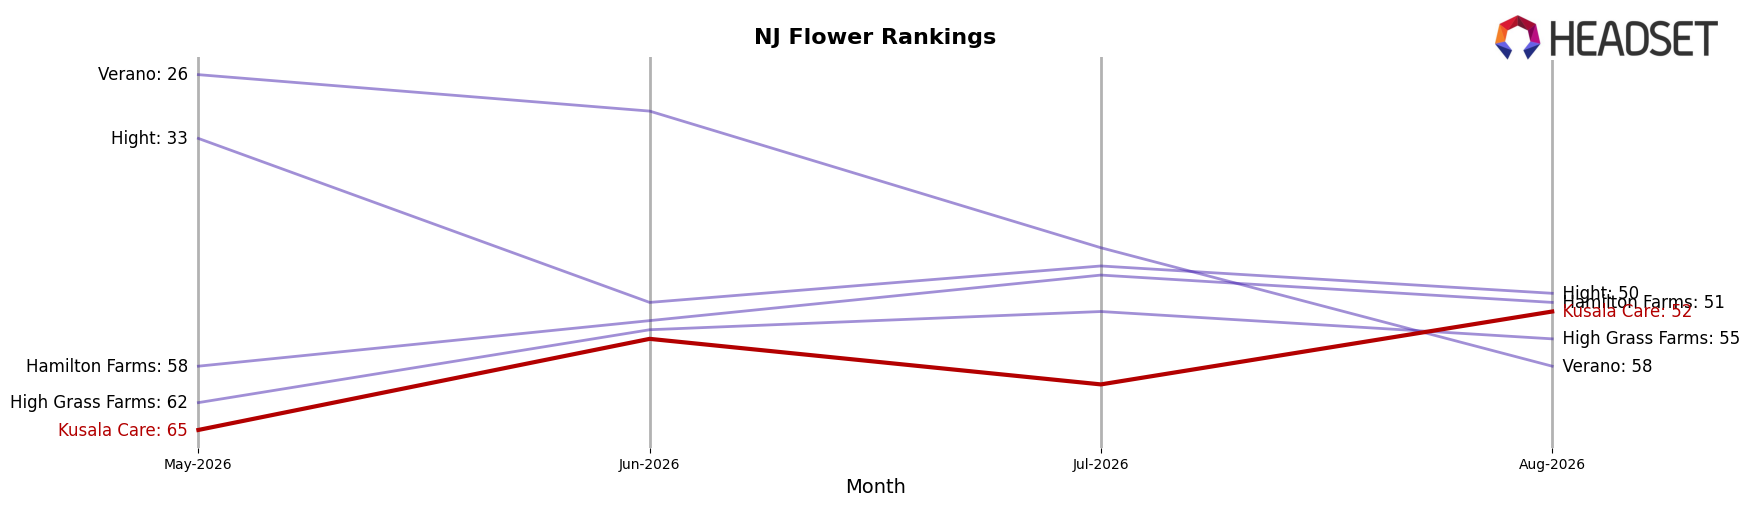
Kusala Care sits at rank #52 in New Jersey Flower in August 2026, with a three-month climb from #65 and a peak at #43 in March 2026 indicating mid-year volatility; while year-over-year rank is unavailable, the current #52 versus the #43 peak suggests a 9-place gap to prior best, and the three-month improvement of 13 positions points to recent stabilization. Competitively, Ozone holds #1 but moved down from #2 year over year with a -18.5% sales change, and Find. advanced to #2 from #5 alongside +40.5% sales growth, indicating that ascent by higher-ranked players is outpacing Kusala Care’s recovery. The pattern implies Kusala Care’s trajectory is improving quarter-on-quarter but not yet closing the distance to March 2026 levels, so maintaining momentum is necessary to convert a 13-rank recent gain into durable top-40 presence.
Notable Products
Koala Kush Pre-Roll (1.75g) posted the standout movement in August 2026 with +101.4% month-over-month and a rank of 9, while GARY PAYTON (3.5g) fell -52.8% MoM to rank 6, indicating share is shifting toward format variety rather than legacy flower leaders. OMG BURGER (3.5g) remained the anchor at rank 1 with +15.4% MoM, and STRAW-PICANNA (3.5g) held rank 3 with +10.3% MoM, while four of the top ten are Flower SKUs, concentrating volume even as Pre-Roll momentum rises. OMG Burger Temple Ball Hash (1g) advanced +43.9% MoM at rank 7, suggesting halo effects from the OMG BURGER flower line that also delivered the month’s highest sales at $43,266. The pattern implies Kusala Care is tilting from a flower-heavy assortment toward a portfolio where Pre-Rolls and branded derivatives capture incremental trials and defend rank positions.
Top Selling Cannabis Brands






Data for this report comes from real-time sales reporting by participating cannabis retailers via their point-of-sale systems, which are linked up with Headset’s business intelligence software. Headset’s data is very reliable, as it comes digitally direct from our partner retailers. However, the potential does exist for misreporting in the instance of duplicates, incorrectly classified products, inaccurate entry of products into point-of-sale systems, or even simple human error at the point of purchase. Thus, there is a slight margin of error to consider. Brands listed on this page are ranked in the top twenty within the market and product category by total retail sales volume.

