Dec-2025
Sales
Trend
6-Month
Product Count
SKUs
Overview
Market Insights Snapshot
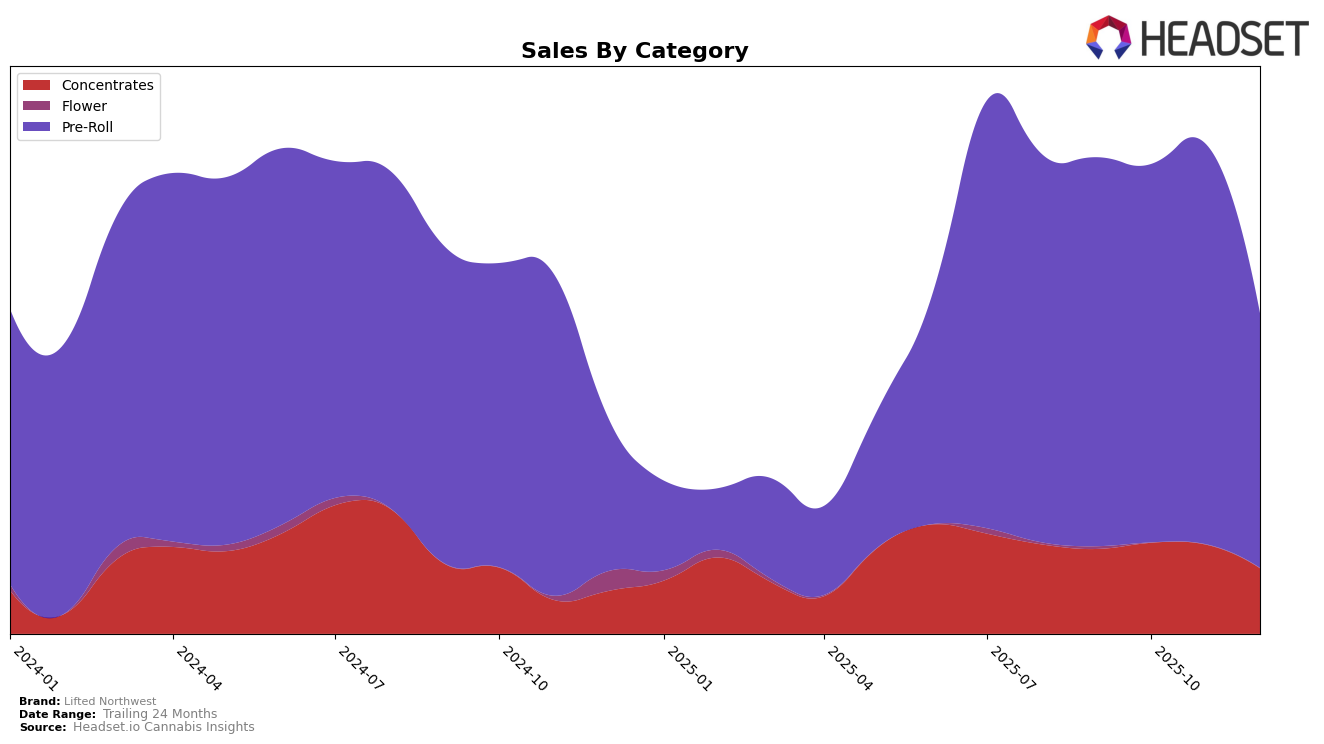
Lifted Northwest has shown varied performance across different product categories and states. In the Oregon market, their performance in the Concentrates category has seen a decline, with the brand dropping out of the top 30 by December 2025, after holding the 29th position in both October and November. This downward trend indicates a potential challenge in maintaining market share in the Concentrates category, which could be due to increased competition or changes in consumer preferences. The sales figures corroborate this trend, showing a decrease from October to December, which suggests that Lifted Northwest might need to reevaluate its strategy in this segment to regain its standing.
Conversely, in the Pre-Roll category in Oregon, Lifted Northwest maintained a strong presence, consistently ranking within the top 20 throughout the last quarter of 2025. Despite a drop from the 10th to the 20th position by December, the brand's ability to stay within the top ranks highlights its competitive edge and popularity among consumers in this category. However, the significant decline in sales from November to December suggests a seasonal or market-specific factor that may have impacted their sales volume. This performance indicates that while Lifted Northwest has a solid footing in the Pre-Roll category, there is room for growth and the need to address factors contributing to the sales decrease in the final month of the year.
Competitive Landscape
In the competitive landscape of Oregon's Pre-Roll category, Lifted Northwest has experienced a notable fluctuation in its ranking and sales performance from September to December 2025. Initially maintaining a strong position at rank 11 in both September and October, Lifted Northwest improved to rank 10 in November, indicating a positive reception and potential growth in market share. However, by December, the brand experienced a significant drop to rank 20, suggesting increased competition and possibly a shift in consumer preferences. Competitors such as Derby's Farm and Entourage Cannabis / CBDiscovery maintained relatively stable positions, with Derby's Farm dropping from rank 12 to 19 and Entourage Cannabis / CBDiscovery holding steady at rank 18. This indicates that while Lifted Northwest faced challenges, other brands also experienced fluctuations, highlighting the dynamic nature of the market. The data suggests that Lifted Northwest may need to reassess its strategies to regain its earlier momentum and address the competitive pressures in the Oregon Pre-Roll market.

Notable Products
In December 2025, the top-performing product for Lifted Northwest was the Runtz Punch Pre-Roll (1g) in the Pre-Roll category, maintaining its consistent number one ranking since September 2025, with sales reaching 2519 units. The Assorted Strains Pre-Roll 5-Pack (5g) held the second position, showing stability in its ranking from the previous months. A new entrant, the Sativa Pre-Roll 10-Pack (10g), debuted at the third rank, indicating a strong market reception. The Emerald Jack x Gridlock Pre-Roll 10-Pack (10g) and Frosted Pound Cake Cured Resin (2g) followed, ranking fourth and fifth respectively. Notably, the introduction of these new products in December reshuffled the rankings, but the top two positions remained unchanged.
Top Selling Cannabis Brands
Data for this report comes from real-time sales reporting by participating cannabis retailers via their point-of-sale systems, which are linked up with Headset’s business intelligence software. Headset’s data is very reliable, as it comes digitally direct from our partner retailers. However, the potential does exist for misreporting in the instance of duplicates, incorrectly classified products, inaccurate entry of products into point-of-sale systems, or even simple human error at the point of purchase. Thus, there is a slight margin of error to consider. Brands listed on this page are ranked in the top twenty within the market and product category by total retail sales volume.


