.svg)

Aug-2026
Sales
Trend
6-Month
Product Count
SKUs
Avg Price
YoY Sales Change
YoY Price Change


Market Insights Snapshot
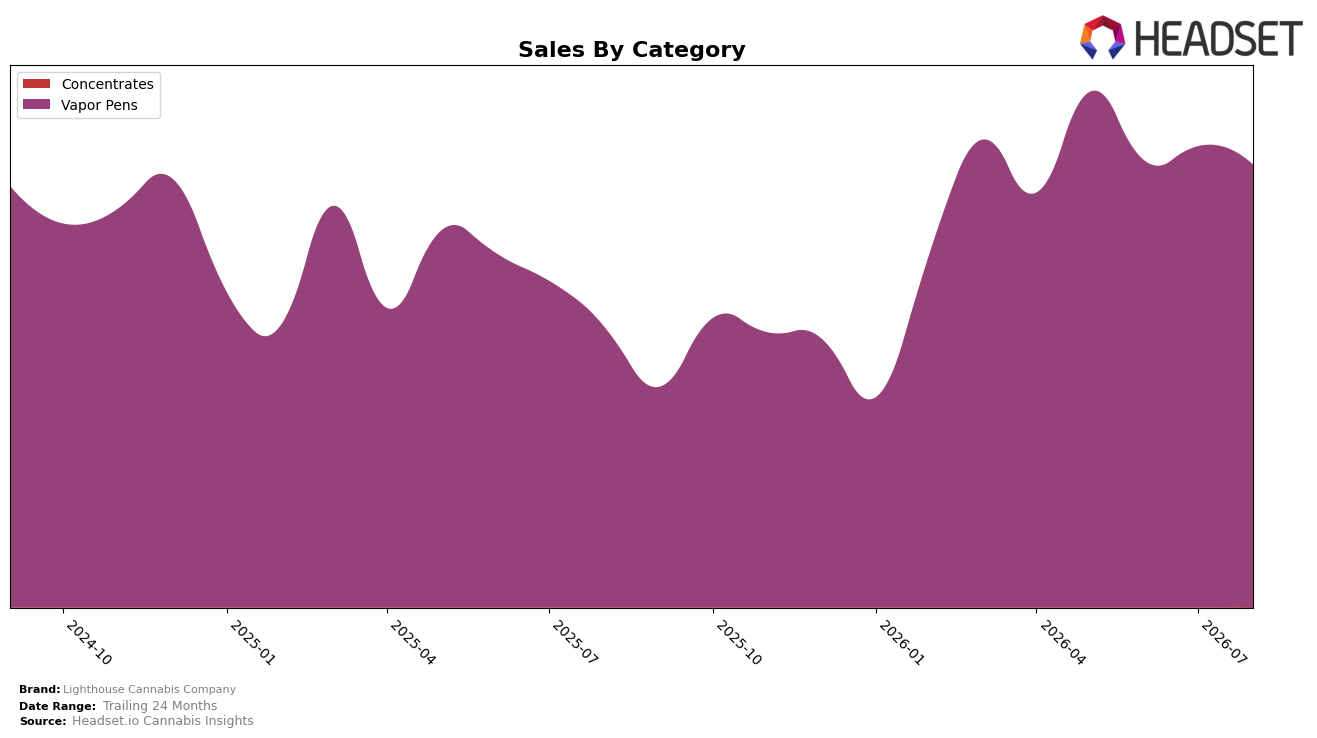
Lighthouse Cannabis Company concentrated 99.91% of August 2026 revenue in Vapor Pens, with a 57.52% year-over-year increase alongside a 4.17% month-over-month decline, while Concentrates held 0.09% share with no measurable year-over-year or month-over-month trend. The brand’s overall sales grew 57.67% year over year as average price slid 2.35%, and the average Vapor Pens ticket sat at $53.26, implying unit expansion despite slight price compression. In Connecticut Vapor Pens, Lighthouse Cannabis Company held rank 2, and the mix-weighted dip versus July 2026 combined with a price decrease suggests the brand leaned on volume to offset softer monthly demand. The pattern implies a single-category engine is driving growth while near-total mix concentration heightens exposure to short-term category swings.
The August 2026 mix leaves Lighthouse Cannabis Company positioned as a Vapor Pens specialist: rank 2 in Connecticut aligns with 99.91% category share of brand sales, but the 4.17% month-over-month pullback paired with a 2.35% lower average price indicates limited shock absorbers when the pen category cools. With 57.52% year-over-year category growth and 57.67% brand-level growth moving in lockstep, Lighthouse Cannabis Company’s performance is effectively tethered to Vapor Pens momentum rather than diversified demand. The implication is clear: maintaining rank while moderating price compression can preserve volume-led gains, but without expanding the 0.09% Concentrates foothold or adding adjacent formats, the brand’s positioning will continue to trade higher year-over-year growth for heightened month-to-month volatility.
Competitive Landscape
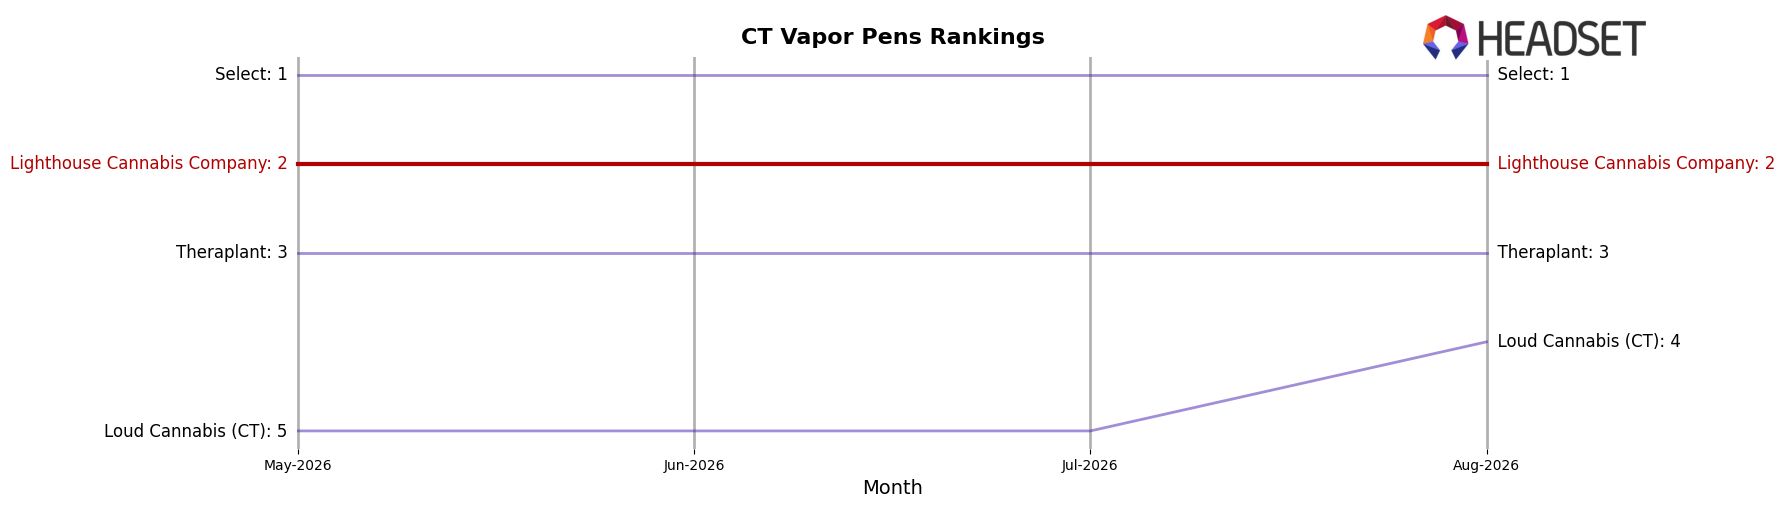
Lighthouse Cannabis Company sits at rank #2 in CT Vapor Pens in August 2026 after improving 2 positions from #4 year over year, and it has held #2 for the past three months while also matching its peak rank of #2 in August 2026; meanwhile, Select moved up from #3 to #1 with 92.13% YoY sales growth and Theraplant slid from #1 to #3 with a 37.81% YoY sales decline, indicating that Lighthouse Cannabis Company’s upward rank stability at #2 amidst competitor churn points to a consolidating position just below the category leader.
Notable Products
Wedding Cake Live Resin Cartridge (1g) posted the steepest decline at -46.0% month over month and slid to rank 10, while Blue Dream Live Resin Cartridge (1g) fell -9.4% and held rank 2, indicating a bifurcation between legacy flavors and emerging winners. Northern Lights Live Resin Cartridge (1g) rose +26.0% to rank 3 as Trainwreck Live Resin Microbar Disposable (1g) inched +3.6% at rank 1, and nine of the top ten SKUs sit in Vapor Pens, pointing to a portfolio concentrated in a single format rather than balanced by form factor. The $123,085 logged by Trainwreck Live Resin Microbar Disposable (1g) alongside a -21.4% slide for Horchata Live Resin Disposable (1g) at rank 9 shows disposables are polarized by strain equity and not the device itself. Altogether, August 2026 signals Lighthouse Cannabis Company leaning into a narrow Vapor Pens-led mix where risk concentrates in a few hero strains, suggesting near-term gains hinge on refreshing underperforming flavors rather than expanding categories.
Top Selling Cannabis Brands






Data for this report comes from real-time sales reporting by participating cannabis retailers via their point-of-sale systems, which are linked up with Headset’s business intelligence software. Headset’s data is very reliable, as it comes digitally direct from our partner retailers. However, the potential does exist for misreporting in the instance of duplicates, incorrectly classified products, inaccurate entry of products into point-of-sale systems, or even simple human error at the point of purchase. Thus, there is a slight margin of error to consider. Brands listed on this page are ranked in the top twenty within the market and product category by total retail sales volume.

