.svg)
Aug-2026
Sales
Trend
6-Month
Product Count
SKUs
Avg Price
YoY Sales Change
YoY Price Change



Where to Buy
CTPharma is stocked at 50 licensed dispensaries across Connecticut, with the deepest coverage in Hamden, New Haven, Norwalk, West Hartford, and Bristol. Search by ZIP code or city below to find the closest one, or filter by product type if you are after a specific format.
Market Insights Snapshot
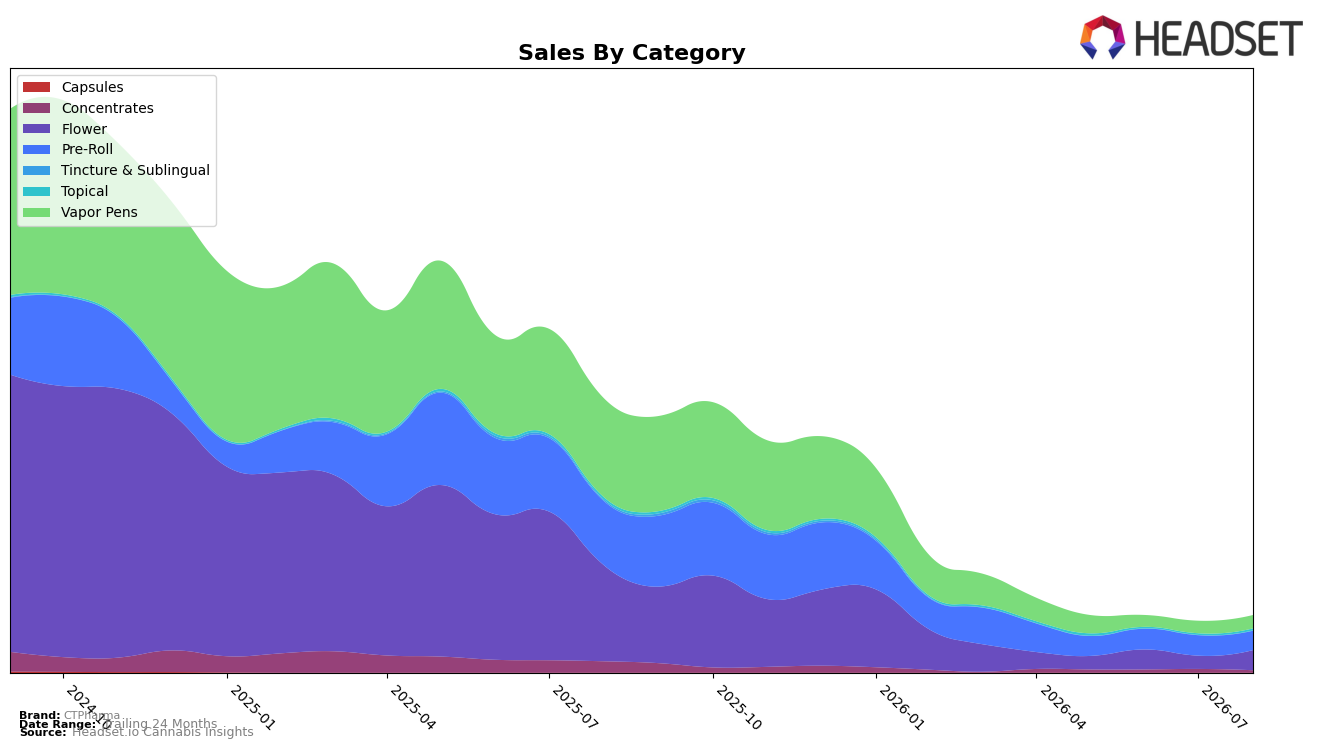
In August 2026, CTPharma’s mix tilted toward Flower at 35.54% share and Pre-Roll at 33.95%, while Vapor Pens held 23.31%; within these, Flower sales were down 79.09% year over year but up 53.74% month over month, and Pre-Roll fell 70.11% year over year with a 5.50% month-over-month decline. Vapor Pens contracted 86.71% year over year but grew 6.70% month over month, and Concentrates dropped 79.92% year over year with a 36.69% month-over-month pullback, as Topical limited its year-over-year decline to 15.23% and rose 30.08% month over month; overall brand sales were down 79.37% year over year alongside a 7.06% decline in average price. The pattern implies a volume-led rebound concentrated in Flower and Topical month over month, but with category reliance on Flower and Pre-Roll keeping the brand exposed to deeper year-over-year contractions.
With Flower ranked 12 in Connecticut and accounting for over one-third of mix, the 53.74% month-over-month gain in Flower alongside a 6.70% month-over-month lift in Vapor Pens suggests CTPharma is leaning into inhalables for near-term recovery, while the 36.69% month-over-month decline in Concentrates and the 5.50% month-over-month dip in Pre-Roll indicate selective retrenchment within adjacent formats. The 30.08% month-over-month increase in Topical, despite only 3.19% share, combined with a 7.06% year-over-year decrease in average price, implies CTPharma is using price-accessible niches to stabilize traffic while prioritizing Flower to defend rank 12 in the state; the mix signals a strategy to regain basket breadth via Topical and sustain core trips via Flower rather than betting on higher-priced Concentrates.
Competitive Landscape
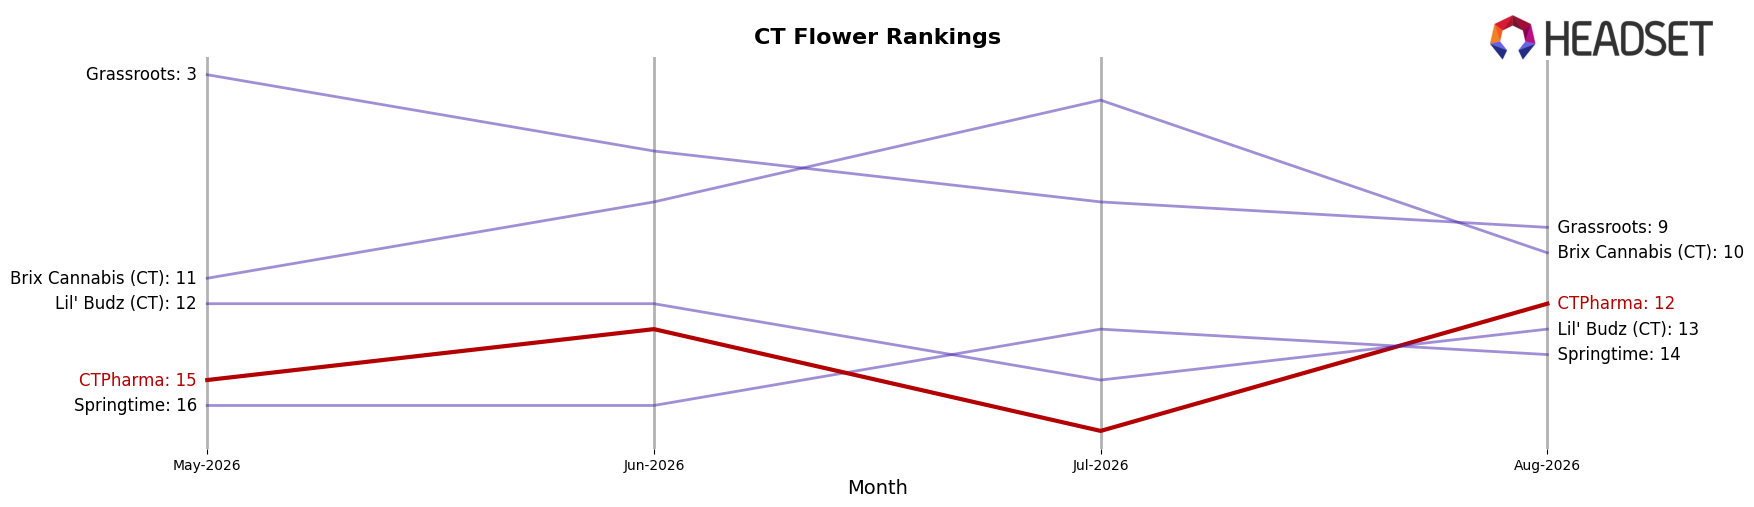
CTPharma sits at rank #12 in August 2026, down 10 positions YoY from rank #2, and it trails its three-month position of #15 by 3 spots, indicating a recent quarter-on-quarter climb but a longer-term slide; meanwhile, Theraplant rose from #9 to #1 YoY while growing sales by 84.61%, and Find. advanced from #17 to #4 YoY with 167.90% sales growth, both outpacing CTPharma’s rank trajectory; given CTPharma’s peak at #1 in July 2025 and its current #12 standing alongside competitors moving 8–13 ranks upward, the pattern implies share is consolidating toward faster-ascending leaders unless CTPharma converts recent 3-rank quarterly improvement into sustained recovery.
Notable Products
Shorties - Jokerz Pre-Roll 5-Pack (2g) posted the sharpest movement in August 2026 with +41.8% month over month and a rise to rank 4, while Glitter Bomb (3.5g) advanced +28.6% month over month and held rank 7. Three of the top four ranks are Pre-Rolls, and five of the top ten are Pre-Rolls overall, indicating a tilt toward ready-to-use formats over Flower SKUs that occupy ranks 3, 5, 7, 8, and 10. Nimbus Snacks THCA Infused Pre-Roll 5-Pack (2g) added +25.8% month over month at rank 9, and Blue Andeze Shorties Pre-Roll 5-Pack (2g) led the board at rank 1 with $28,143 in August 2026. The pattern points to CTPharma prioritizing multi-pack Pre-Rolls to capture repeat convenience buyers while Flower maintains anchor positions without matching Pre-Roll velocity.
Top Selling Cannabis Brands






Data for this report comes from real-time sales reporting by participating cannabis retailers via their point-of-sale systems, which are linked up with Headset’s business intelligence software. Headset’s data is very reliable, as it comes digitally direct from our partner retailers. However, the potential does exist for misreporting in the instance of duplicates, incorrectly classified products, inaccurate entry of products into point-of-sale systems, or even simple human error at the point of purchase. Thus, there is a slight margin of error to consider. Brands listed on this page are ranked in the top twenty within the market and product category by total retail sales volume.

