Market Insights Snapshot
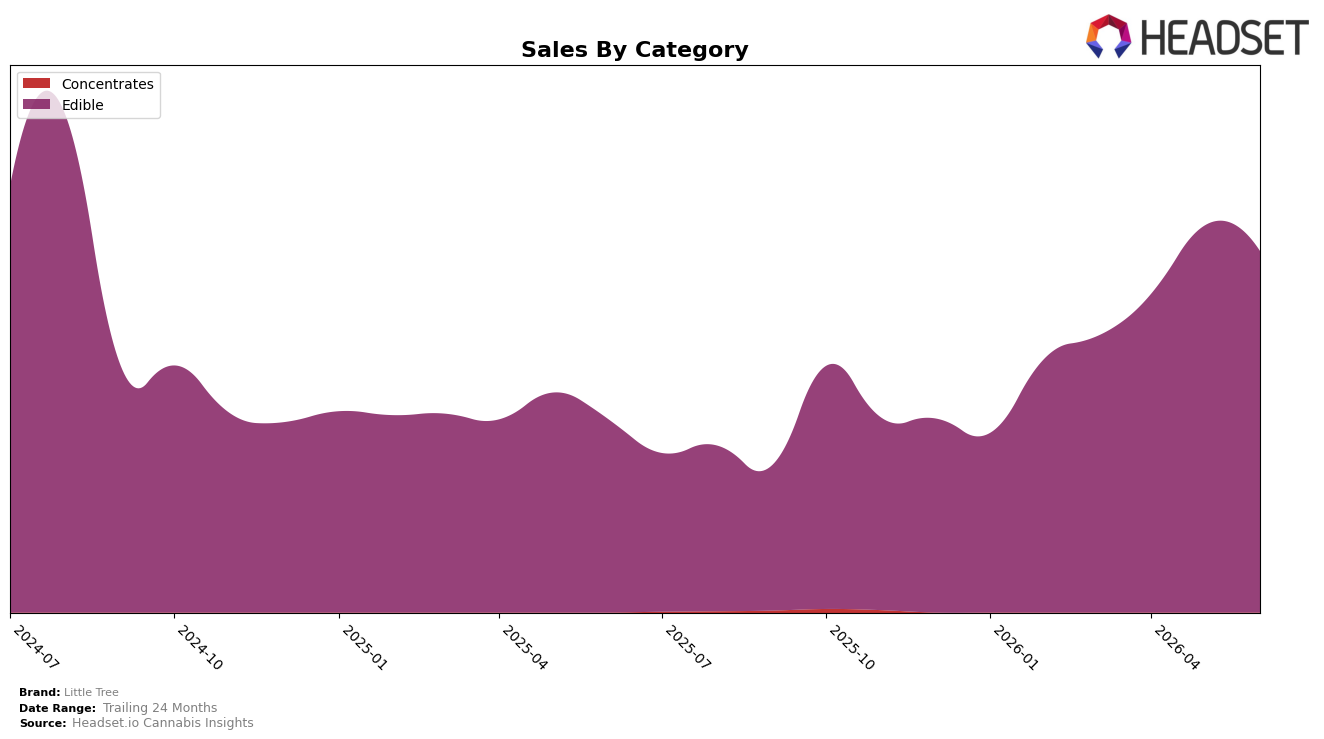
Edible holds 100.0% of Little Tree’s mix in June 2026, with year-over-year sales up 87.12% but month-over-month down 6.59%, alongside a 23.93% drop in average price. The brand sits at rank 29 in Edible in Michigan, indicating share gains year-over-year paired with short-term price-led softness month-over-month. The pattern implies Little Tree is concentrating entirely in a single category while trading price for velocity, boosting annual growth but compressing near-term revenue per unit.
With 100.0% category concentration and a rank of 29 in Michigan Edibles, the 87.12% year-over-year surge alongside a 6.59% month-over-month dip and a 23.93% price decline implies a value-led positioning rather than premium. The thesis is that Little Tree’s pricing strategy is prioritizing penetration and rank stability within Edibles over diversification, which can sustain annual growth but raises risk if month-over-month softness persists at lower price points.
Competitive Landscape
Little Tree sits at rank #29 in June 2026 in MI Edible, improving 16 positions from #45 year over year, and tightening from #33 three months ago to #29 now; against this, category leaders show mixed momentum as Wyld held #1 with a -13.4% YoY sales change while MKX Oil Company stayed at #3 with +10.8% YoY sales growth, and Good Tide slipped from #4 to #5 amid a -16.2% YoY decline. Little Tree remains below its August 2024 peak rank of #23 while Choice held #2 year over year with a -1.8% YoY sales shift, and Camino climbed from #5 to #4 on +15.7% YoY growth; this pattern implies Little Tree’s multi-quarter rank gains are recovery-driven but still lagging the pace-setters that are consolidating top-5 positions.

Notable Products
Red Razz High Chew (200mg) delivered the standout move in June 2026 with a 160.5% month-over-month jump into rank 2, while High Chew - Blue Razz Gummies (200mg) fell 12.2% yet held rank 1. Blue Razz Hash Rosin Gummies 10-Pack (200mg) declined 15.0% at rank 6, and Cherry High Chew (200mg) climbed 59.4% at rank 5, indicating momentum concentrated in a narrow set of High Chew SKUs. With all top ten positions in the Edible category and at least four of the top ten in the High Chew family, the mix implies Little Tree is tilting further toward a flavor-driven gummy portfolio where a few breakout SKUs can reset the leaderboard.
Top Selling Cannabis Brands
Data for this report comes from real-time sales reporting by participating cannabis retailers via their point-of-sale systems, which are linked up with Headset’s business intelligence software. Headset’s data is very reliable, as it comes digitally direct from our partner retailers. However, the potential does exist for misreporting in the instance of duplicates, incorrectly classified products, inaccurate entry of products into point-of-sale systems, or even simple human error at the point of purchase. Thus, there is a slight margin of error to consider. Brands listed on this page are ranked in the top twenty within the market and product category by total retail sales volume.

