Market Insights Snapshot
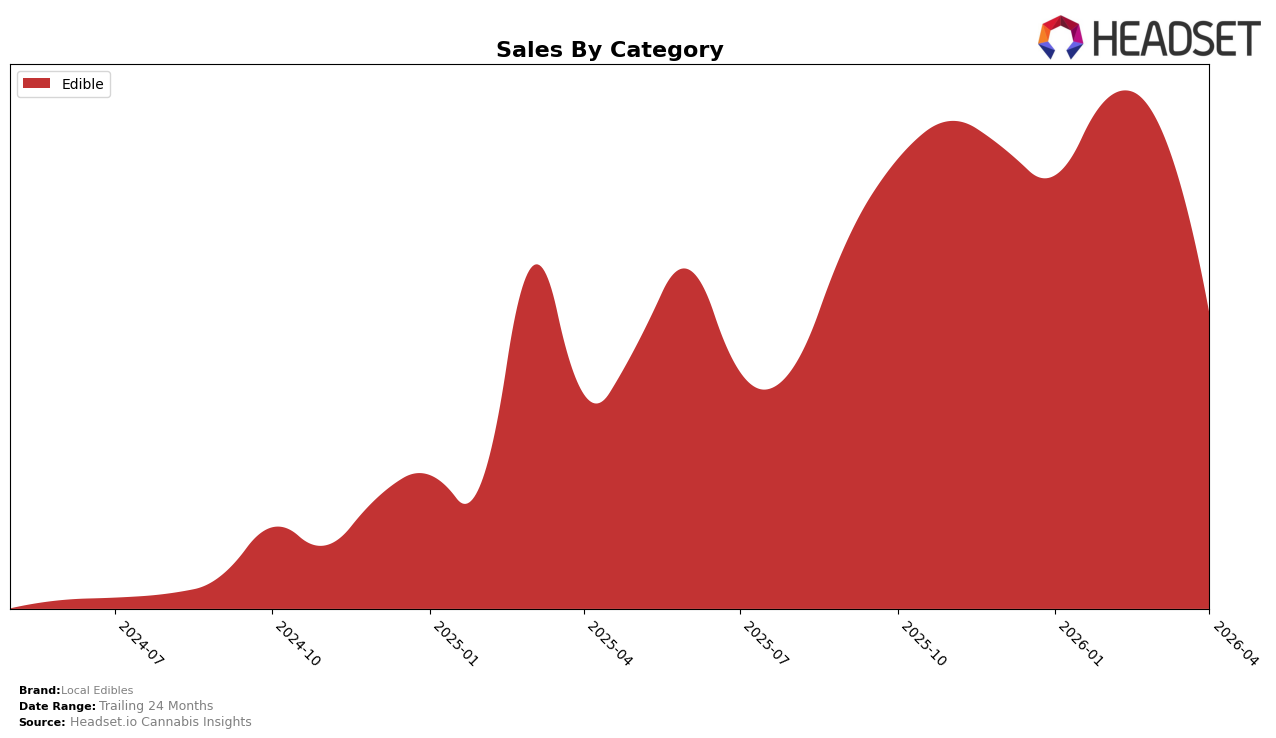
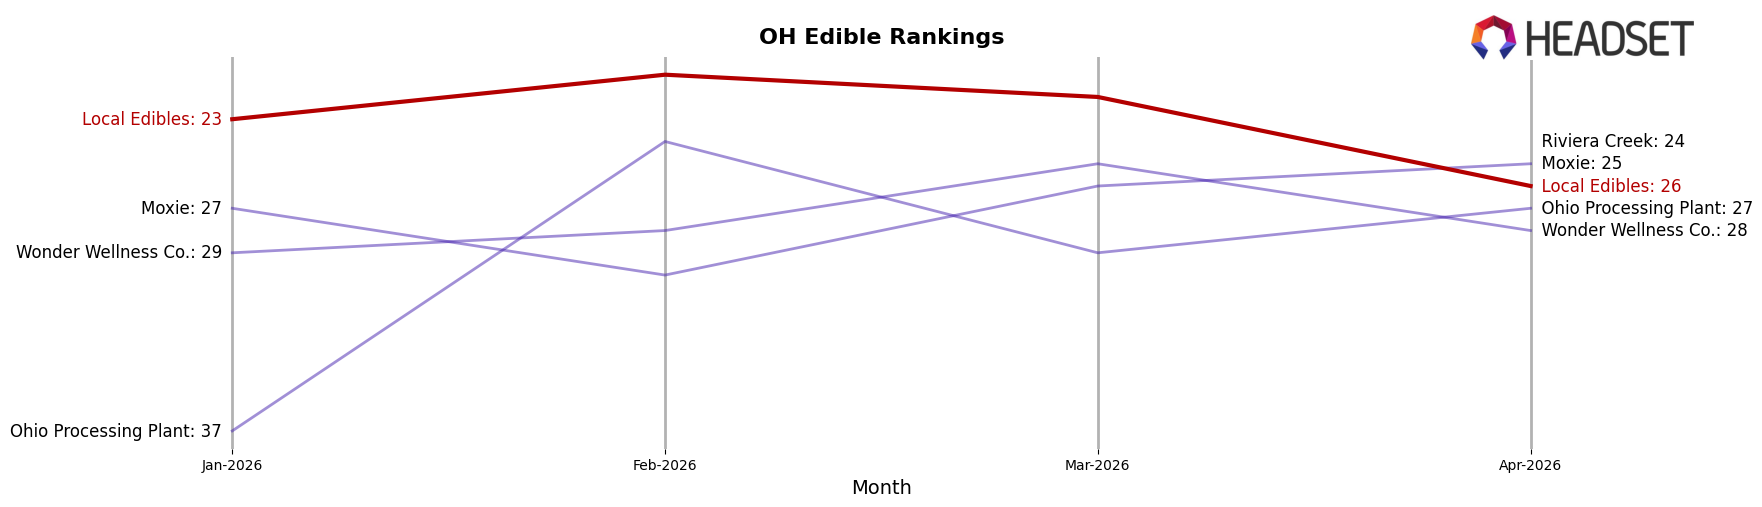
Local Edibles has shown varied performance across different states and categories, indicating a dynamic presence in the market. In Ohio, the brand has been consistently ranked within the top 30 in the Edible category, although there was a slight decline from 21st place in February 2026 to 26th place by April 2026. This ranking shift could suggest increasing competition or changing consumer preferences in Ohio. Despite a decrease in sales from March to April, the brand still managed to maintain a presence in the rankings, which is a testament to its resilience in a competitive market.
While Local Edibles has maintained a foothold in Ohio, the absence of ranking data in other states or categories implies that the brand is not yet making a significant impact beyond this region or within different product categories. This could be seen as a potential area of growth for Local Edibles, as expanding their reach could help stabilize and increase their market presence. The brand's performance in Ohio, despite fluctuations, provides a foundation that could be leveraged for broader market penetration. The insights from Ohio's market dynamics could guide strategic decisions for expansion into other states or categories where the brand is currently not ranking in the top 30.
Competitive Landscape
In the competitive landscape of the edible cannabis market in Ohio, Local Edibles has experienced notable fluctuations in its rank and sales from January to April 2026. Initially ranked 23rd in January, Local Edibles climbed to 21st in February, demonstrating a positive momentum, but then saw a decline to 26th by April. This drop in rank coincides with a significant decrease in sales from $133,670 in February to $77,996 in April. In contrast, Moxie and Wonder Wellness Co. have shown more stable performance, with Moxie improving its rank from 27th to 25th and Wonder Wellness Co. maintaining a relatively consistent position despite a dip in sales in April. Notably, Riviera Creek emerged in the rankings in April at 24th, indicating a potential new competitor for Local Edibles to watch. These dynamics suggest that while Local Edibles has had strong sales figures, the brand may need to address competitive pressures and market shifts to regain its earlier momentum.
Notable Products
In April 2026, the top-performing product from Local Edibles was Pineapple Gummies 10-Pack (550mg), maintaining its number 1 rank from February with a sales figure of 276. The Pear Mango Gummies 10-Pack (550mg) held the second position, consistent with its February ranking, though its sales slightly decreased. Black Cherry Gummies 10-Pack (550mg) dropped from its top spot in March to third place in April. Milk Chocolate Bar 10-Pack (220mg) entered the ranks at fourth place, showing a strong debut. Razzleberry Live Liquid Diamond Gummies 10-Pack (110mg) slipped to fifth place from its third position in March, indicating a decline in popularity.
Top Selling Cannabis Brands
Data for this report comes from real-time sales reporting by participating cannabis retailers via their point-of-sale systems, which are linked up with Headset’s business intelligence software. Headset’s data is very reliable, as it comes digitally direct from our partner retailers. However, the potential does exist for misreporting in the instance of duplicates, incorrectly classified products, inaccurate entry of products into point-of-sale systems, or even simple human error at the point of purchase. Thus, there is a slight margin of error to consider. Brands listed on this page are ranked in the top twenty within the market and product category by total retail sales volume.

