.svg)



Where to Buy
Loud Pax is stocked at 18 licensed dispensaries across Arizona and Michigan, 9 of them in Arizona, with the deepest coverage in Phoenix, Apache Junction, Florence, Prescott Valley, and Tempe. Search by ZIP code or city below to find the closest one, or filter by product type if you are after a specific format.
Market Insights Snapshot
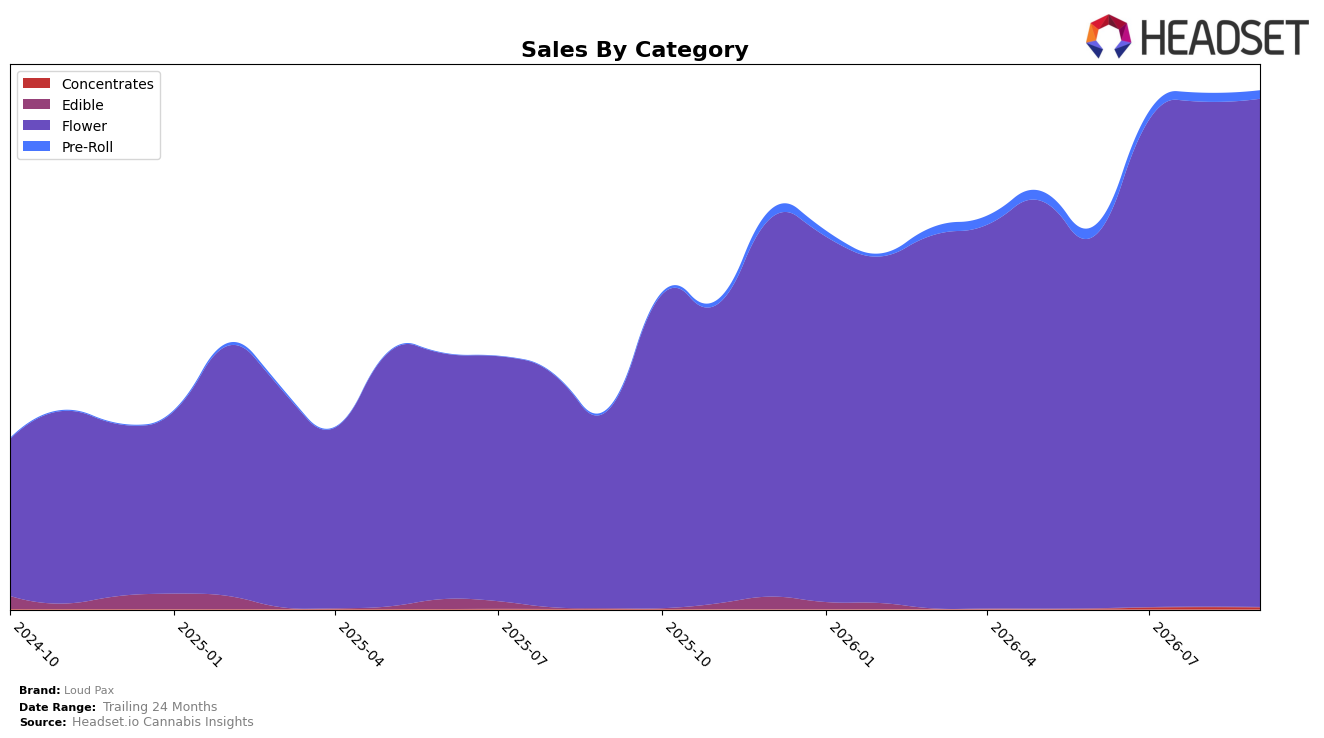
In September 2026, Loud Pax concentrated 98.11% of sales in Flower while holding only 1.56% in Pre-Roll and 0.33% in Concentrates, indicating a skew that widened despite mixed monthly movements. Flower grew 156.64% year over year with just 0.65% month over month, whereas Pre-Roll expanded 413.94% year over year but declined 5.41% month over month, and Concentrates surged 1,240.11% year over year yet fell 14.79% month over month. With the brand ranking 5 in Flower in Arizona and average price down 16.58% year over year to $27.70, the mix implies price-led volume capture in the core while the smaller formats carry volatility; the thesis is that Loud Pax is anchoring share by defending Flower rank while using tactical pricing to backfill softer month-over-month category pockets.
The pattern signals a positioning strategy centered on maintaining Flower rank 5 in Arizona through price-enabled accessibility (−16.58% average price YoY) and incremental experimentation in Pre-Roll and Concentrates where month-over-month pullbacks of 5.41% and 14.79% suggest limited repeat traction despite triple-digit year-over-year growth. Because 98.11% of the mix is tied to a category with only 0.65% month-over-month growth, the brand’s exposure risk is concentration-heavy, even as overall brand sales rose 159.01% year over year; the thesis is that sustaining Flower rank requires stabilizing secondary categories to smooth monthly volatility without diluting the Flower-centric identity.
Competitive Landscape
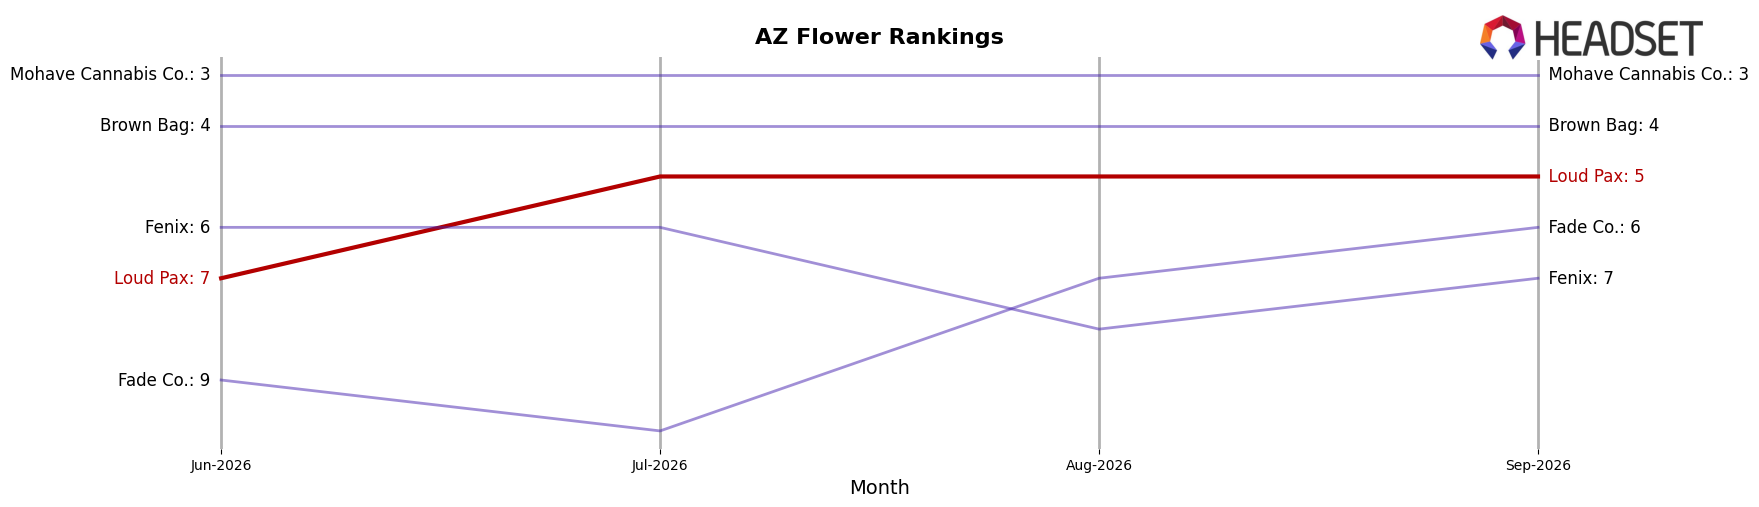
Loud Pax is ranked #5 in AZ Flower in September 2026, improving 46 positions year over year from #51 and rising 2 spots since June 2026 from #7, while also hitting a new peak rank of #5 in September 2026. In contrast, Just Flower held #1 year over year and in September 2026 with a 29.0% YoY sales increase, and Brown Bag moved from #4 year over year to #4 in September 2026 with an 80.4% YoY sales increase, indicating Loud Pax’s ascent is ranking-driven rather than sales-growth-led against leaders with double-digit gains. Find. advanced from #3 year over year to #2 with 56.6% YoY sales growth, while Mohave Cannabis Co. slipped from #2 year over year to #3 despite 6.0% YoY growth, positioning Loud Pax’s jump from #51 to #5 as a share-recapture pattern reliant on sustained month-over-month retention at the edge of the top five.
Notable Products
Dulce Vida Infused Shake (14g) posted the steepest movement in September 2026 with a -45.8% month-over-month drop while sitting at rank 5, and Atomic Breath (3.5g) slipped a milder -2.4% at rank 10, which together point to price- or pack-size sensitivity at the lower end of the top 10. Green RTZ (3.5g) and Seattle Soda (3.5g) occupied ranks 1 and 2 respectively, and with Flower accounting for eight of the top ten SKUs, the assortment is concentrated in eighth-ounce and half-ounce preferences even as the lone large-format decline signals volatility in value-driven Flower. Watermelon Dream (3.5g) held rank 3 and Dough Lato (14g) sat at rank 9 with $76,102 in September 2026 sales, indicating that rank leadership is anchored by classic 3.5g formats while 14g formats bifurcate between a high-performing outlier and a sharp decliner. The pattern implies Loud Pax is leaning into 3.5g Flower dominance while reevaluating large-format positioning to avoid margin and demand whipsaws.
Top Selling Cannabis Brands






Data for this report comes from real-time sales reporting by participating cannabis retailers via their point-of-sale systems, which are linked up with Headset’s business intelligence software. Headset’s data is very reliable, as it comes digitally direct from our partner retailers. However, the potential does exist for misreporting in the instance of duplicates, incorrectly classified products, inaccurate entry of products into point-of-sale systems, or even simple human error at the point of purchase. Thus, there is a slight margin of error to consider. Brands listed on this page are ranked in the top twenty within the market and product category by total retail sales volume.

