Market Insights Snapshot
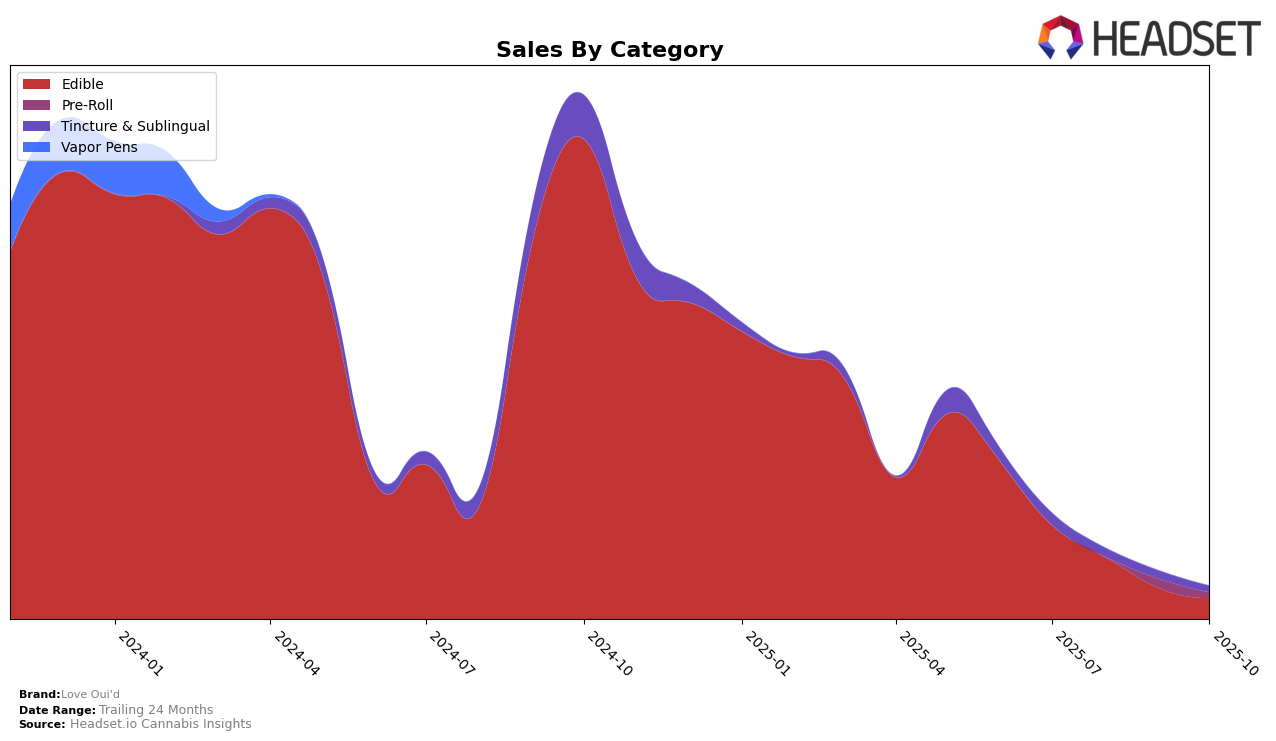
In the state of New York, Love Oui'd's performance in the Edible category has seen notable fluctuations over the past few months. In July 2025, the brand ranked 75th, but it subsequently fell out of the top 30 rankings in the following months of August, September, and October. This drop indicates a significant decline in their market presence in New York's Edible category, which could be a point of concern for the brand's stakeholders. The absence from the top 30 rankings suggests that Love Oui'd may need to reassess its strategy in this category to regain its competitive edge.
While specific sales figures for the months following July are not provided, the initial sales data from July 2025 shows that Love Oui'd generated $12,003 in sales within the Edible category. This figure, combined with the lack of subsequent rankings, suggests a possible decline in consumer interest or increased competition in the New York market. Understanding the underlying causes of this drop could be crucial for Love Oui'd to make strategic adjustments and improve its standing in future rankings. Observing trends in other states or categories could provide further insights into the brand's overall market performance and potential areas for growth.
Competitive Landscape
In the New York edible cannabis market, Love Oui'd faces a competitive landscape marked by fluctuating rankings and sales trends. As of July 2025, Love Oui'd held the 75th rank, but it did not appear in the top 20 for subsequent months, indicating a potential challenge in maintaining visibility compared to competitors. Notably, Jams was ranked 51st in July 2025, suggesting a stronger market presence, while Bison Botanics improved slightly from 71st to 70th between July and August. Meanwhile, Ithaca Organics Cannabis Co. was ranked 74th in July, just ahead of Love Oui'd, and Glenna's appeared at 72nd in August. These competitors show varying degrees of market traction, with Love Oui'd needing strategic efforts to bolster its rank and sales in a competitive New York edible market.

Notable Products
In October 2025, the top-performing product from Love Oui'd was the Soccer Bomb - Aldo OG Pre-Roll 2-Pack (1g) in the Pre-Roll category, maintaining its first-place ranking from September with notable sales of 105 units. The CBD/THC/CBN 4:1:1 Ginger Sleep Gummies 20-Pack (400mg CBD, 100mg THC, 100mg CBN) remained stable in second place across both September and October. Lychee Energy Gummies 20-Pack (100mg) held the third position, showing consistency in its ranking from the previous month. The Zen Tincture (300mg THC, 30ml) maintained its fourth-place ranking from September to October. Notably, the CBD/THC 10:1 Flow Tincture (300mg CBD, 30mg THC) dropped out of the top five in October after being ranked fifth in September.
Top Selling Cannabis Brands
Data for this report comes from real-time sales reporting by participating cannabis retailers via their point-of-sale systems, which are linked up with Headset’s business intelligence software. Headset’s data is very reliable, as it comes digitally direct from our partner retailers. However, the potential does exist for misreporting in the instance of duplicates, incorrectly classified products, inaccurate entry of products into point-of-sale systems, or even simple human error at the point of purchase. Thus, there is a slight margin of error to consider. Brands listed on this page are ranked in the top twenty within the market and product category by total retail sales volume.

