Jun-2026
Sales
Trend
6-Month
Product Count
SKUs
Avg Price
YoY Sales Change
YoY Price Change
Market Insights Snapshot
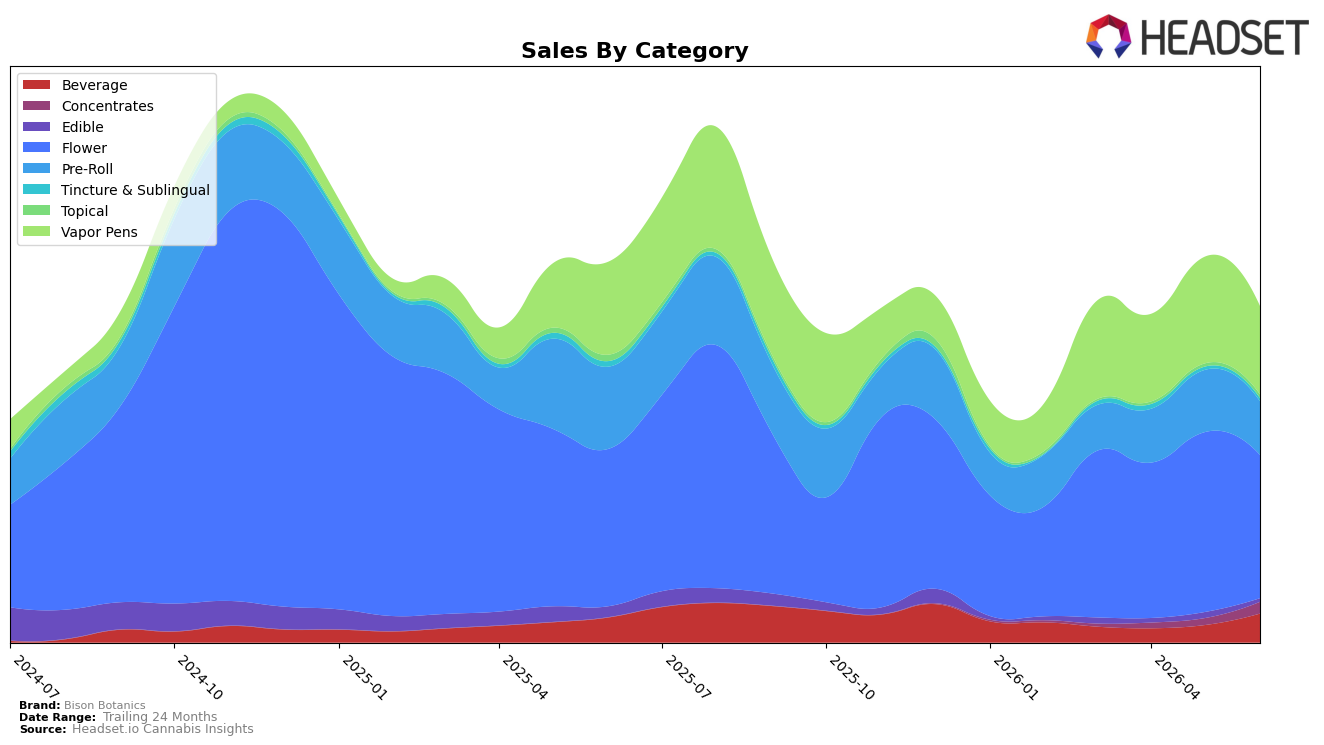
In June 2026, Bison Botanics concentrated sales in Flower at 42.83% share with year-over-year change of -8.96% and month-over-month change of -20.39%, while Vapor Pens held 26.36% share with -5.03% YoY and -17.29% MoM; Pre-Roll slipped to 15.97% share with -34.90% YoY and -13.81% MoM, and Beverage expanded to 8.62% share with +15.99% YoY and +66.61% MoM. Smaller lines were mixed: Concentrates rose +72.59% MoM (no YoY), Topical gained +15.17% MoM but was -45.47% YoY, and Edible contracted -69.29% YoY and -43.08% MoM, with Tincture & Sublingual flat MoM at +0.06% and -44.18% YoY. With total brand sales -11.71% YoY alongside an average price decline of -19.38%, the pattern implies a pivot from premium-priced inhalables toward value-accessible segments, as evidenced by Beverage outpacing other categories on both a +66.61% MoM surge and a +15.99% YoY lift while core Flower and Vapor Pens retrenched.
The mix shift signals recalibration toward lower-ticket, higher-velocity units: average price at $21.54 alongside Beverage’s +66.61% MoM and Concentrates’ +72.59% MoM suggests trial-driven volume can offset Flower’s -20.39% MoM and Pre-Roll’s -13.81% MoM only if share continues migrating from the 42.83% Flower base. Given a Flower rank of 93 in New York and category YoY declines of -8.96% in Flower versus +15.99% in Beverage, positioning hinges on leaning into differentiated non-inhalable formats while pruning laggards like Edible at -69.29% YoY; the implication is that Bison Botanics can trade category mix for velocity, accepting lower price points to stabilize total sales against inhalable softness.
Competitive Landscape
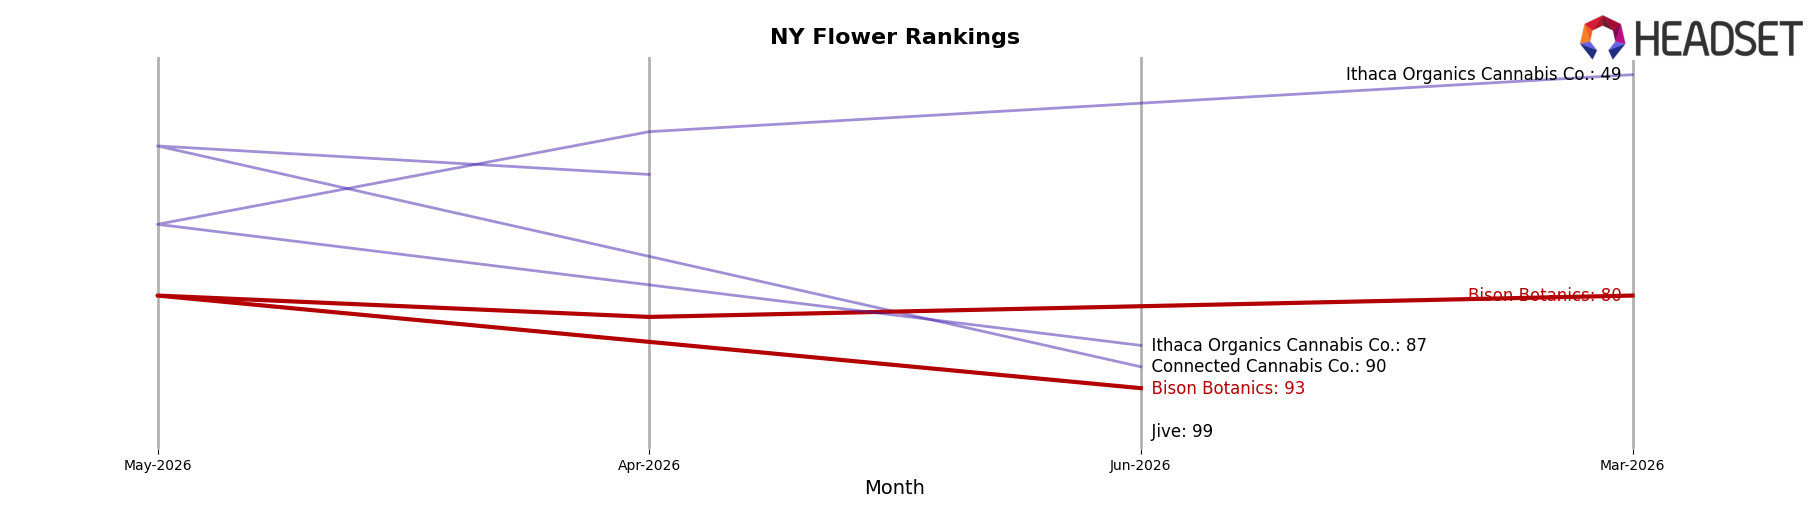
Bison Botanics sits at rank #93 in NY Flower in June 2026, down 22 positions year over year from #71 and slipping 13 spots since March 2026 from #80, a reversal from its peak at #29 in December 2024; meanwhile, category leaders moved the other way, with Find. climbing from #3 to #1 alongside a 35.6% year-over-year sales increase, and RYTHM rising from #10 to #5 with a 40.6% gain, while Dank. By Definition slid from #1 to #3 despite a 50.7% sales decline; the combined upward mobility of top competitors and Bison Botanics’ downward rank trajectory indicates share is consolidating among faster-advancing brands, implying Bison Botanics is being outpaced in shelf velocity and retailer preference.
Notable Products
Loganberry Sparkling Beverage (10mg THC, 355ml, 12oz) delivered the standout move in June 2026 with a 365.8% month-over-month surge and a jump to rank 2, signaling accelerated traction for beverages. In contrast, Funk Juice (3.5g) fell 49.2% MoM while holding rank 3, and Ocean Fruit (3.5g) declined 15.5% at rank 5, indicating pressure within Flower even as Nana Glue (3.5g) was roughly flat at -0.8% in rank 4. With Wild Strawberry Rhubarb Lemonade (10mg THC, 355ml, 12oz) up 10.3% at rank 1 and just $9,308 in June 2026 sales separating the top beverage from the rest, the category’s momentum contrasts with Vapor Pens where Funk Juice Distillate Disposable (1g) slipped 10.3% at rank 9 and Tiger Blood Distillate Cartridge (1g) dropped 24.7% at rank 10. The pattern implies Bison Botanics is pivoting toward beverages as a growth engine while Flower and Vapor Pens face share headwinds that necessitate SKU rationalization or price-pack adjustments.
Top Selling Cannabis Brands
Data for this report comes from real-time sales reporting by participating cannabis retailers via their point-of-sale systems, which are linked up with Headset’s business intelligence software. Headset’s data is very reliable, as it comes digitally direct from our partner retailers. However, the potential does exist for misreporting in the instance of duplicates, incorrectly classified products, inaccurate entry of products into point-of-sale systems, or even simple human error at the point of purchase. Thus, there is a slight margin of error to consider. Brands listed on this page are ranked in the top twenty within the market and product category by total retail sales volume.

