Jan-2025
Sales
Trend
6-Month
Product Count
SKUs
Overview
Market Insights Snapshot
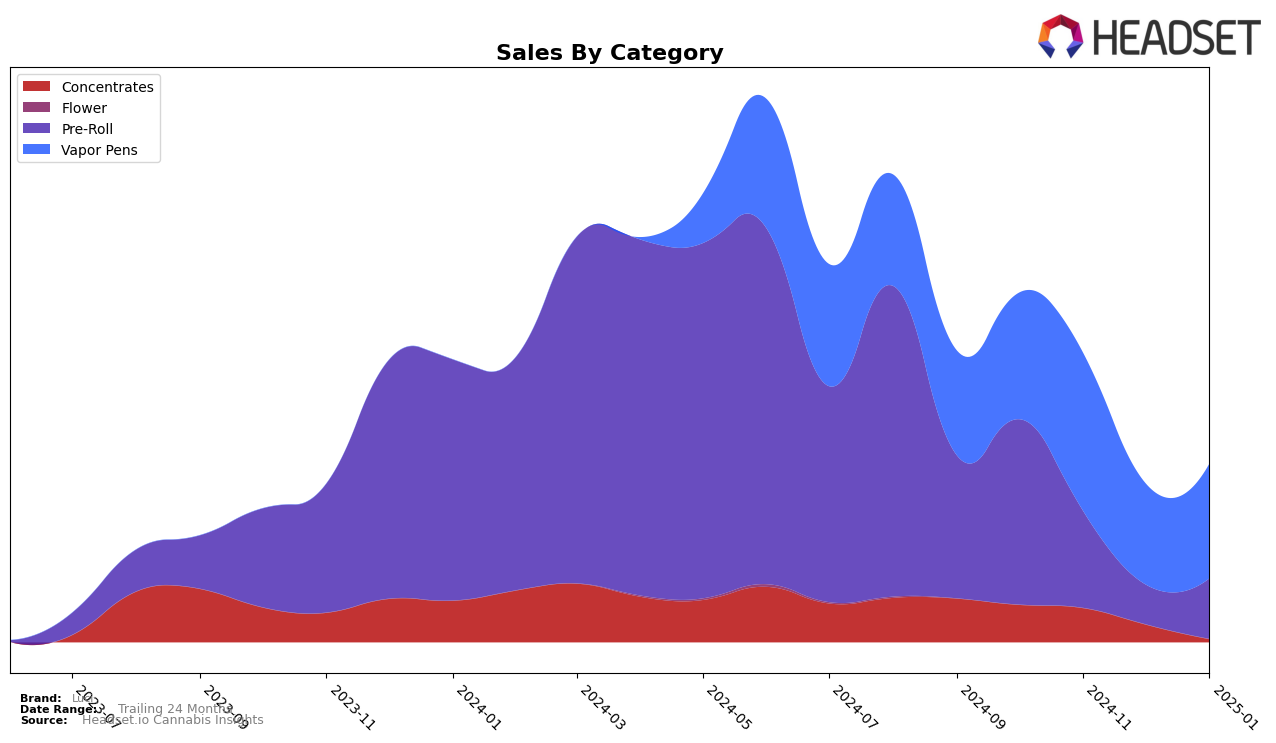
In the state of New York, Luci has shown varied performance across different cannabis categories. The brand's presence in the Concentrates category has experienced a decline, with rankings slipping from 18th in October 2024 to being absent from the top 30 by January 2025. This drop in ranking indicates a significant decrease in market presence, which could be a point of concern for the brand. Conversely, in the Vapor Pens category, Luci has maintained a relatively stable position, hovering around the 44th rank throughout the observed period, suggesting a consistent, albeit modest, performance in this segment.
In the Pre-Roll category, Luci's performance in New York has been more volatile. Starting at 36th in October 2024, the brand's ranking fell to 75th by December 2024 but saw a slight recovery to 69th in January 2025. This fluctuation could reflect changes in consumer preferences or competitive dynamics within the market. Despite the ups and downs, the brand managed to achieve a noticeable sales figure in October 2024, highlighting a potential area for growth if the brand can stabilize its ranking and capture more market share.
Competitive Landscape
In the competitive landscape of vapor pens in New York, Luci has maintained a relatively stable position, ranking 44th in October and November 2024, dropping slightly to 46th in December, and returning to 44th in January 2025. This consistency in rank, despite fluctuations in sales, suggests a resilient brand presence amidst shifting market dynamics. Notably, OMO - Open Minded Organics consistently outperformed Luci, holding a higher rank throughout the period, which could indicate a stronger market appeal or customer loyalty. Meanwhile, Ruby Farms and MyHi showed varying degrees of competition, with MyHi improving its rank from 63rd to 49th, suggesting a potential upward trend that could pose a future threat to Luci's market share. Luci's sales saw a notable dip in December, which coincided with its drop in rank, highlighting the importance of maintaining consistent sales performance to secure a stable market position. Overall, while Luci holds a steady rank, the competitive pressure from both established and rising brands necessitates strategic efforts to enhance its market standing in the vapor pen category in New York.

Notable Products
In January 2025, Cheese Dawg Live Rosin Disposable (0.5g) maintained its position as the top-performing product for Luci, continuing its dominance from the previous months with a notable sales figure of 716 units. The Granddaddy Purp Infused Pre-Roll 5-Pack (2.5g) climbed to the second position, up from third in December 2024, showing significant growth in the Pre-Roll category. Blueberry Muffin Infused Pre-Roll (1g) emerged as a new contender, securing the third spot in its debut month. Grass Valley Girl Live Resin Disposable (0.5g) experienced a drop to fourth place, having previously been second in December. Sploosh Live Resin Disposable (0.5g) rounded out the top five, slipping one position from fourth in the previous month.
Top Selling Cannabis Brands
Data for this report comes from real-time sales reporting by participating cannabis retailers via their point-of-sale systems, which are linked up with Headset’s business intelligence software. Headset’s data is very reliable, as it comes digitally direct from our partner retailers. However, the potential does exist for misreporting in the instance of duplicates, incorrectly classified products, inaccurate entry of products into point-of-sale systems, or even simple human error at the point of purchase. Thus, there is a slight margin of error to consider. Brands listed on this page are ranked in the top twenty within the market and product category by total retail sales volume.


