.svg)

Aug-2026
Sales
Trend
6-Month
Product Count
SKUs
Avg Price
YoY Sales Change
YoY Price Change


Where to Buy
Magi Cannabis is stocked at 42 licensed dispensaries across Mississippi, Michigan, and Washington, 27 of them in Mississippi, with the deepest coverage in Jackson, Columbus, Hattiesburg, Hernando, and Meridian. Search by ZIP code or city below to find the closest one, or filter by product type if you are after a specific format.
Market Insights Snapshot
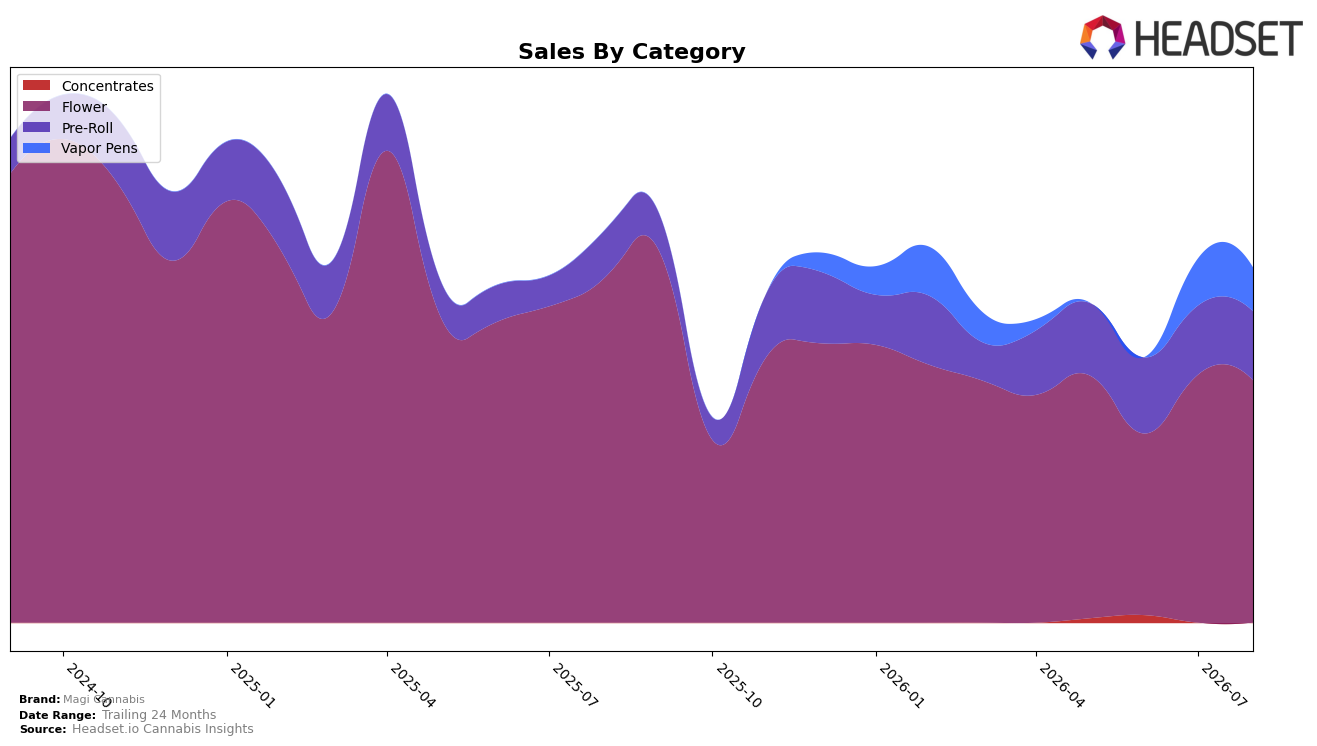
In August 2026, Magi Cannabis concentrated 68.34% of sales in Flower, where year-over-year sales fell 29.67% and month-over-month declined 2.29%, while Pre-Roll expanded to 19.38% share with a 46.34% year-over-year gain and a 0.16% month-over-month dip. Vapor Pens held 12.28% share with a 6.99% month-over-month contraction and no year-over-year comp, and the brand’s average price moved down 15.92% year-over-year alongside an overall brand sales decline of 9.43% year-over-year. With Flower ranked 37th in British Columbia and Flower’s share still exceeding two-thirds, the mix shift implies dependency on a declining core while momentum concentrates in Pre-Roll, pressing the brand to rebalance toward faster-turning formats without eroding price further.
The combination of a 29.67% year-over-year Flower decline against a 46.34% Pre-Roll increase and a 6.99% month-over-month slide in Vapor Pens indicates Magi Cannabis is migrating demand toward lower-priced, high-velocity units while premium Flower underperforms at rank 37 in British Columbia. Given brand sales are down 9.43% year-over-year despite category gains in Pre-Roll, the pattern implies pricing and portfolio architecture are diluting average revenue per unit, and sustained reliance on a 68.34% Flower mix risks further share loss unless Pre-Roll and Vapor Pens are scaled to offset Flower’s contraction.
Competitive Landscape
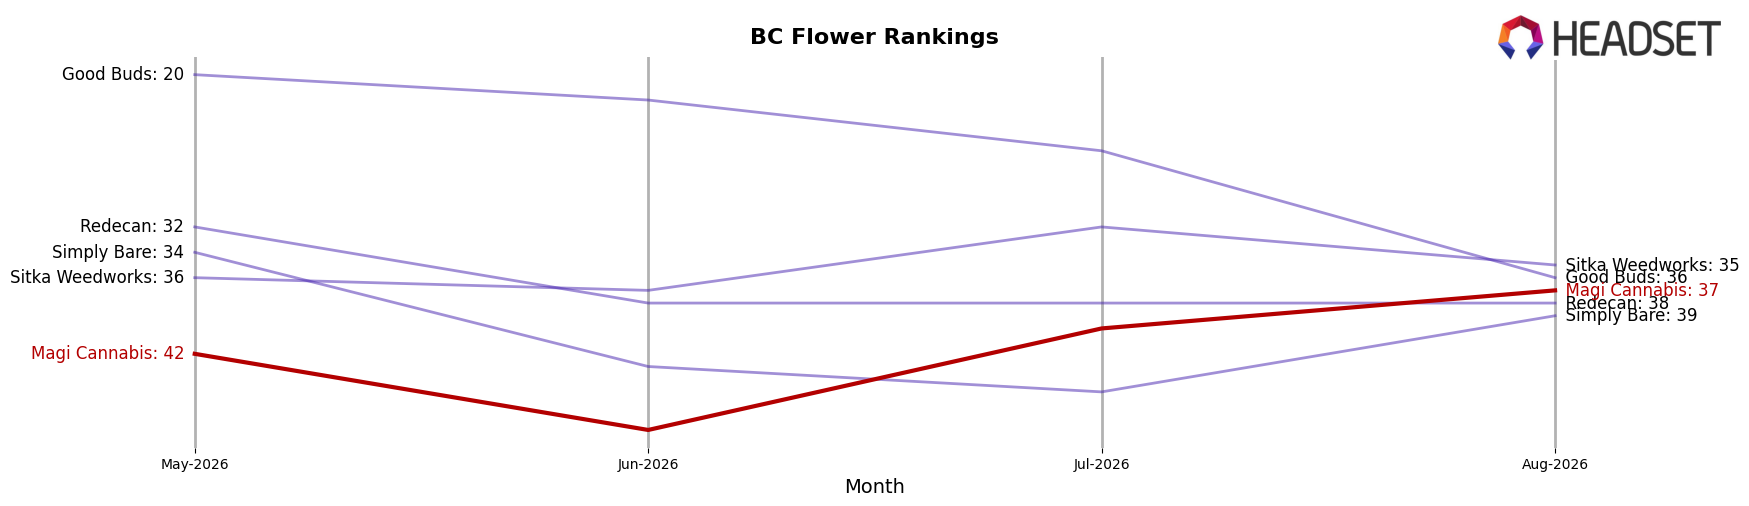
Magi Cannabis sits at rank #37 in BC Flower in August 2026, down 10 places year over year from #27, but up 5 places versus three months ago from #42; this gap between a 10-rank YoY decline and a 5-rank short-term recovery indicates recent stabilization after a longer slide. Competitive pressure is acute at the top: Big Bag O' Buds held #1 year over year and remains #1, while Spinach climbed from #4 to #2 with 54.18% YoY sales growth, and Good Supply rose from #6 to #3 alongside 91.79% YoY sales growth; against that backdrop, Magi Cannabis’s peak at #22 in January 2025 versus today’s #37 underscores share loss to faster-rising competitors. The pattern implies Magi Cannabis is ceding long-term rank to aggressive leaders but has near-term momentum to arrest further declines if it converts recent three-month gains into sustained share recovery.
Notable Products
Pine Tar (28g) delivered the largest month-over-month surge at 103.1% while jumping into rank 6, and Pine Tar Pre-Roll 3-Pack (1.5g) followed with a 70.0% gain at rank 5, indicating upsizing and format-extension momentum within the Pine Tar line. At the same time, Block Party Variety Pack Pre-Roll 20-Pack (10g) held rank 1 despite a -4.3% dip, whereas SaltSpring Love Child Cured Resin Disposable (1g) slipped -7.0% at rank 2, setting up a trade-up pattern toward larger Flower pack sizes. Four of the top ten are Flower SKUs spanning Pine Tar and Timmy's OG Shark, with Timmy OG Shark (7g) up 38.9% at rank 9 and Timmy's OG Shark (14g) up 6.5% at rank 8, reinforcing a pivot toward mid- to large-size Flower even as pre-rolls anchor the top slot. The mix implies Magi Cannabis is consolidating demand in value-oriented multi-gram Flower while using pre-rolls as entry points, a direction that prioritizes basket-size expansion over breadth of formats.
Top Selling Cannabis Brands






Data for this report comes from real-time sales reporting by participating cannabis retailers via their point-of-sale systems, which are linked up with Headset’s business intelligence software. Headset’s data is very reliable, as it comes digitally direct from our partner retailers. However, the potential does exist for misreporting in the instance of duplicates, incorrectly classified products, inaccurate entry of products into point-of-sale systems, or even simple human error at the point of purchase. Thus, there is a slight margin of error to consider. Brands listed on this page are ranked in the top twenty within the market and product category by total retail sales volume.

