.svg)
Aug-2026
Sales
Trend
6-Month
Product Count
SKUs
Avg Price
YoY Sales Change
YoY Price Change


Where to Buy
Magic Gardens is stocked at 13 licensed dispensaries across Washington, with the deepest coverage in Seattle, Burlington, Kenmore, Lacey, and Mountlake Terrace. Search by ZIP code or city below to find the closest one.
Market Insights Snapshot
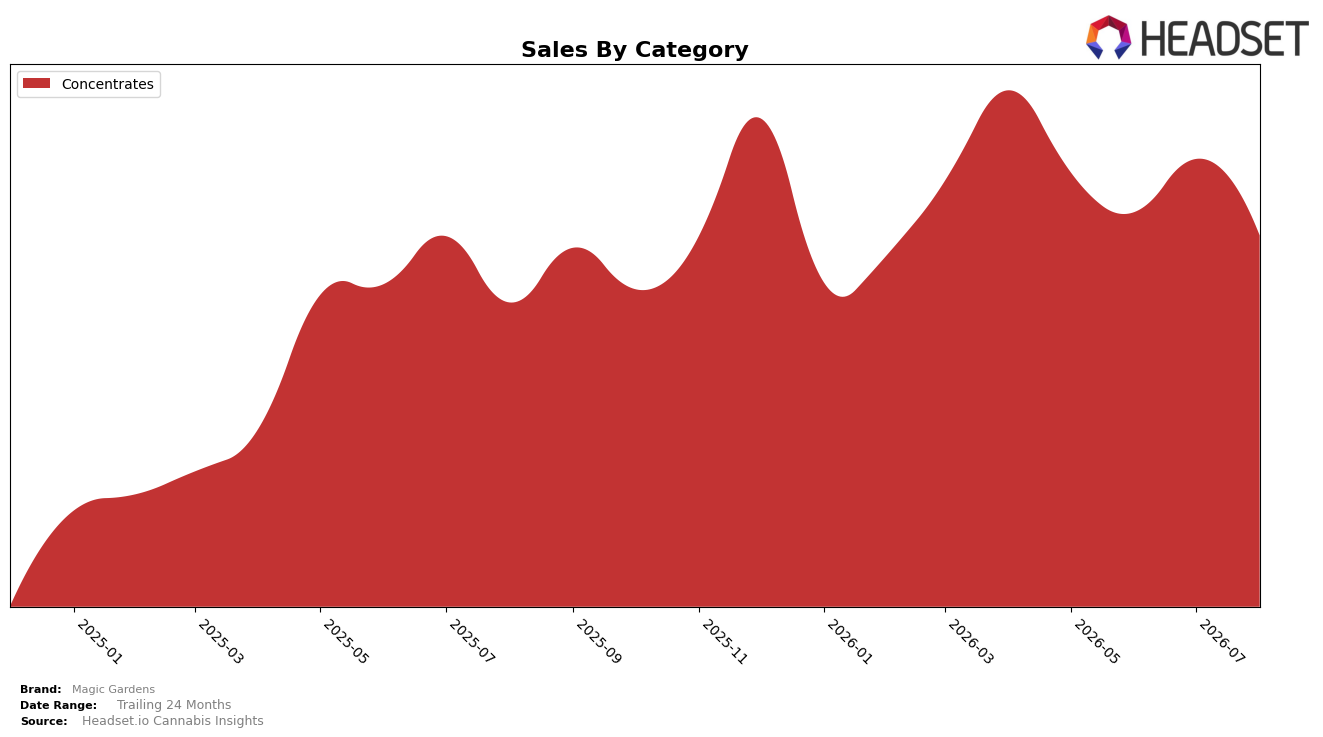
In August 2026, Magic Gardens operated as a single-category brand with Concentrates at 100.0% of sales, concentrating all mix into one lane while category sales were up 21.8% year over year and down 17.0% month over month. Average item price fell 22.4% YoY alongside a 16.963559920688166% MoM sales decline, while the brand’s rank in Concentrates sat at position 32 in Washington. The pattern implies a price-led volume strategy in a single-category footprint that lifted annual throughput but did not prevent an August pullback, leaving headroom to improve rank from 32 if MoM softness can be stabilized.
The combination of a 22.4% YoY price drop and 21.8% YoY sales increase, paired with a 17.0% MoM contraction, indicates elasticity is working annually but not cushioning short-term demand shocks, which keeps Magic Gardens anchored at rank 32 in Concentrates. With 100.0% of revenue tied to one category and Washington as the top market, the lack of category diversification amplifies monthly volatility; the pattern implies that incremental share gains will likely come from deeper penetration within Concentrates rather than mix expansion, and that price architecture, not assortment breadth, is the near-term lever.
Competitive Landscape
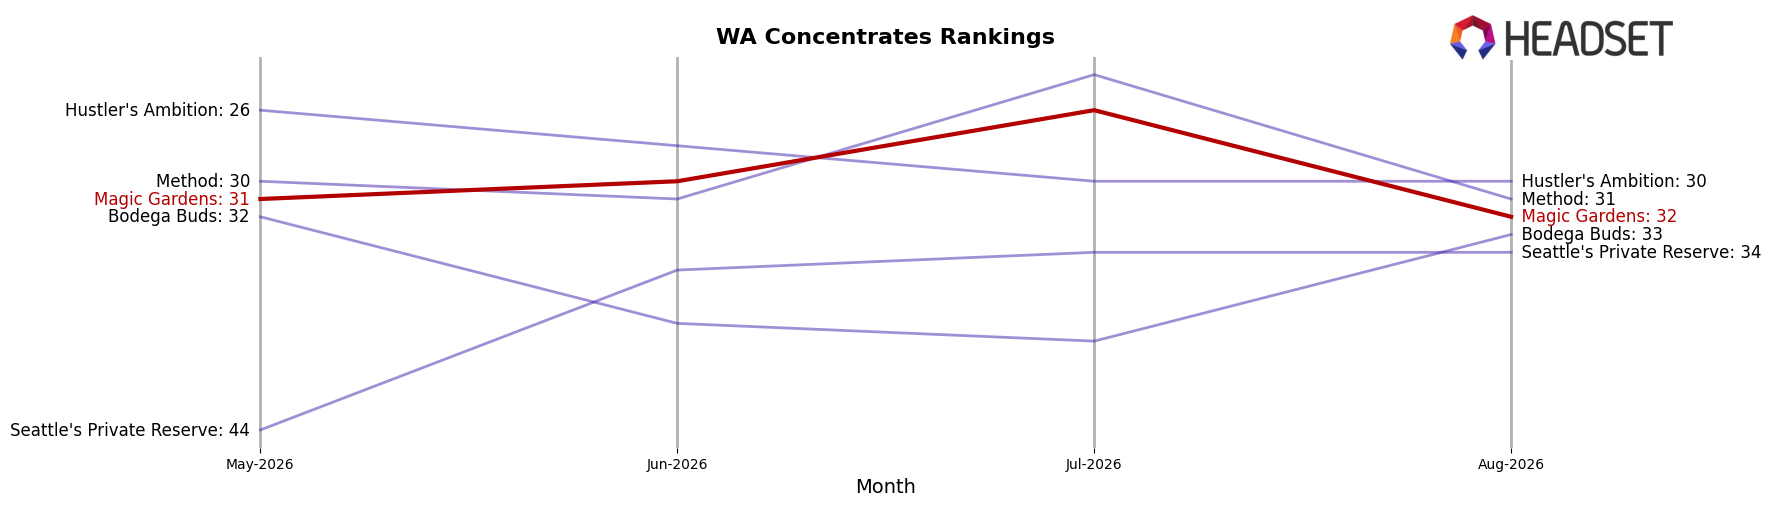
Magic Gardens is ranked #32 in WA Concentrates in August 2026, improving 13 positions from #45 year over year, but slipping 1 spot from #31 in May 2026 while also coming off a peak at #26 in July 2026; this mix of a 13-rank YoY climb and a 6-rank drop from the recent peak points to volatility rather than steady momentum. Competitive pressure is visible at the top as Ooowee held #1 while posting a -6.13% YoY sales change, whereas Constellation Cannabis advanced from #6 to #4 with +15.88% YoY sales, and Buddy Boy Farms surged from #56 to #5 on +456.87% YoY sales; against that backdrop, Magic Gardens’ +13 ranks YoY alongside a -6 ranks from July 2026 suggests mid-tier share is attainable but fragile without sustained month-over-month gains.
Notable Products
GMO Hash Rosin (1g) delivered the headline move in August 2026 with a +58.9% month-over-month surge to rank 1, while Super Boof X BCC Jealousy Hash Rosin (1g) fell -47.6% to rank 7, indicating sharp redistribution within the lineup. Twinkiez #4 Hash Rosin (1g) slid -31.7% into rank 2 even as Ice Cream Cake Solventless Hash Rosin (1g) gained +16.6% at rank 5, pointing to volatility concentrated among mid-top positions. With all top-10 items in Concentrates and four in the top five tied to solventless hash rosin, the mix signals a pivot toward premium rosin formats and tighter SKU focus rather than broad flavor proliferation.
Top Selling Cannabis Brands






Data for this report comes from real-time sales reporting by participating cannabis retailers via their point-of-sale systems, which are linked up with Headset’s business intelligence software. Headset’s data is very reliable, as it comes digitally direct from our partner retailers. However, the potential does exist for misreporting in the instance of duplicates, incorrectly classified products, inaccurate entry of products into point-of-sale systems, or even simple human error at the point of purchase. Thus, there is a slight margin of error to consider. Brands listed on this page are ranked in the top twenty within the market and product category by total retail sales volume.

