May-2026
Sales
Trend
6-Month
Product Count
SKUs
Avg Price
YoY Sales Change
YoY Price Change
Market Insights Snapshot
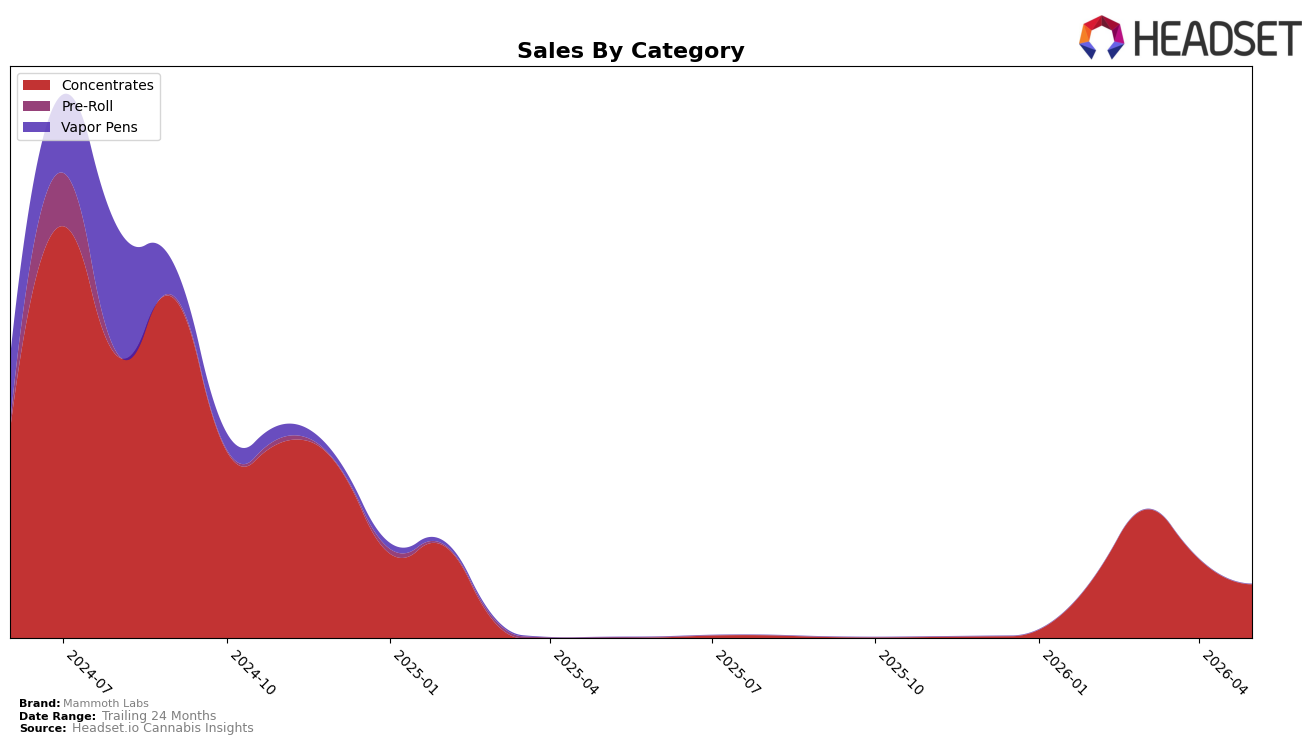
Mammoth Labs operated as a single-category brand in May 2026, with Concentrates accounting for 100.0% of sales and a month-over-month decline of 32.25% alongside a year-over-year brand-level increase of 11656.60%. The average item price rose 61.28% year over year to $9.03 while mix stayed fully concentrated in Concentrates, and the absence of any rank in Nevada suggests distribution or velocity gaps even as category reliance remained total. The pattern implies a price-led rebound on a narrow base: steep MoM contraction against a large YoY surge indicates volume volatility within Concentrates rather than diversified growth.
With 100.0% of sales tied to Concentrates and a 32.25% MoM pullback hitting the only category, Mammoth Labs’ positioning is highly sensitive to intra-category swings despite the 61.28% YoY price lift supporting revenue per unit. Coupled with a 24-month sales change of -82.52% and no listed category rank in Nevada, the configuration signals that short-term gains from pricing are not yet translating to stable shelf presence or multi-category insulation. The implication is a concentration risk: single-category dependence amplifies volatility, so sustaining the May 2026 YoY momentum requires either steadier Concentrates velocity or incremental category breadth to dampen month-to-month shocks.
Competitive Landscape
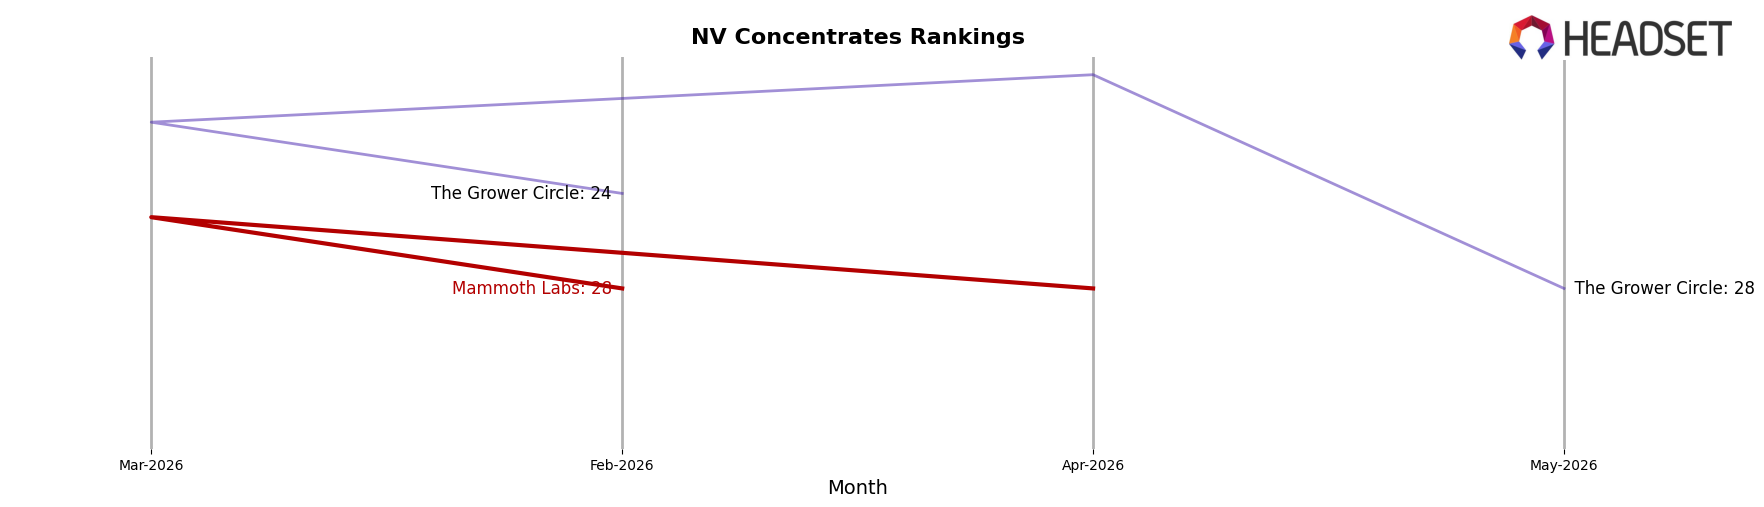
Mammoth Labs is ranked #30 in NV Concentrates in May 2026, slipping 2 positions from #28 in February 2026, with no year-over-year rank reported; meanwhile, the category leader Medizin held #1 with a -22.9% year-over-year sales change, and Nature's Chemistry surged to #4 from #25 alongside a 430.3% year-over-year sales increase. Compared with &Shine at #5 and down from #4 year over year (-23.1% sales), Mammoth Labs’ drift from a peak of #10 in September 2024 to #30 in May 2026 and a 2-rank decline over the last three months indicates share is consolidating above it as faster-rising incumbents and climbers compress the mid-tier; the trajectory implies Mammoth Labs risks further relegation unless it re-enters the top-20 corridor where momentum brands are concentrating.
Notable Products
Pinesol Kush Live Resin Badder (2g) posted the largest month-over-month gain at +63.7% while climbing to rank 4, and Citrus Breadsticks Live Resin Badder (2g) followed at +52.1% at rank 3, together indicating a shift toward larger 2g formats. In contrast, Apples and Bananas Live Resin Badder (0.05g) fell -84.0% to rank 6 and Apples and Bananas Live Resin Badder (2g) dropped -54.0% to rank 6, even as Citrus Breadsticks Live Resin Badder (0.05g) rose +11.0% to rank 1, pointing to a flavor-specific divergence rather than a format-wide issue. Four of the top ten are Concentrates badder SKUs concentrated in Citrus Breadsticks and Pinesol Kush across 0.05g and 2g, with Citrus Breadsticks Live Resin Badder (0.05g) leading the board at rank 1 alongside Pinesol Kush Live Resin Badder (0.05g) at rank 2, which suggests the brand can lean into these two strain lines while rationalizing Apples and Bananas. The product mix implies Mammoth Labs is consolidating around two winning strain families with momentum in 2g packs, prioritizing depth over breadth to capture repeat buyers and stabilize rank positions.
Top Selling Cannabis Brands
Data for this report comes from real-time sales reporting by participating cannabis retailers via their point-of-sale systems, which are linked up with Headset’s business intelligence software. Headset’s data is very reliable, as it comes digitally direct from our partner retailers. However, the potential does exist for misreporting in the instance of duplicates, incorrectly classified products, inaccurate entry of products into point-of-sale systems, or even simple human error at the point of purchase. Thus, there is a slight margin of error to consider. Brands listed on this page are ranked in the top twenty within the market and product category by total retail sales volume.

