.svg)

Aug-2026
Sales
Trend
6-Month
Product Count
SKUs
Avg Price
YoY Sales Change
YoY Price Change


Where to Buy
Pressure Concentrates (NV) is stocked at 92 licensed dispensaries across California, Oklahoma, and 2 other states, 30 of them in California, with the deepest coverage in Modesto, Santa Cruz, Aptos, Calexico, and Capitola. Search by ZIP code or city below to find the closest one, or filter by product type if you are after a specific format.
Market Insights Snapshot
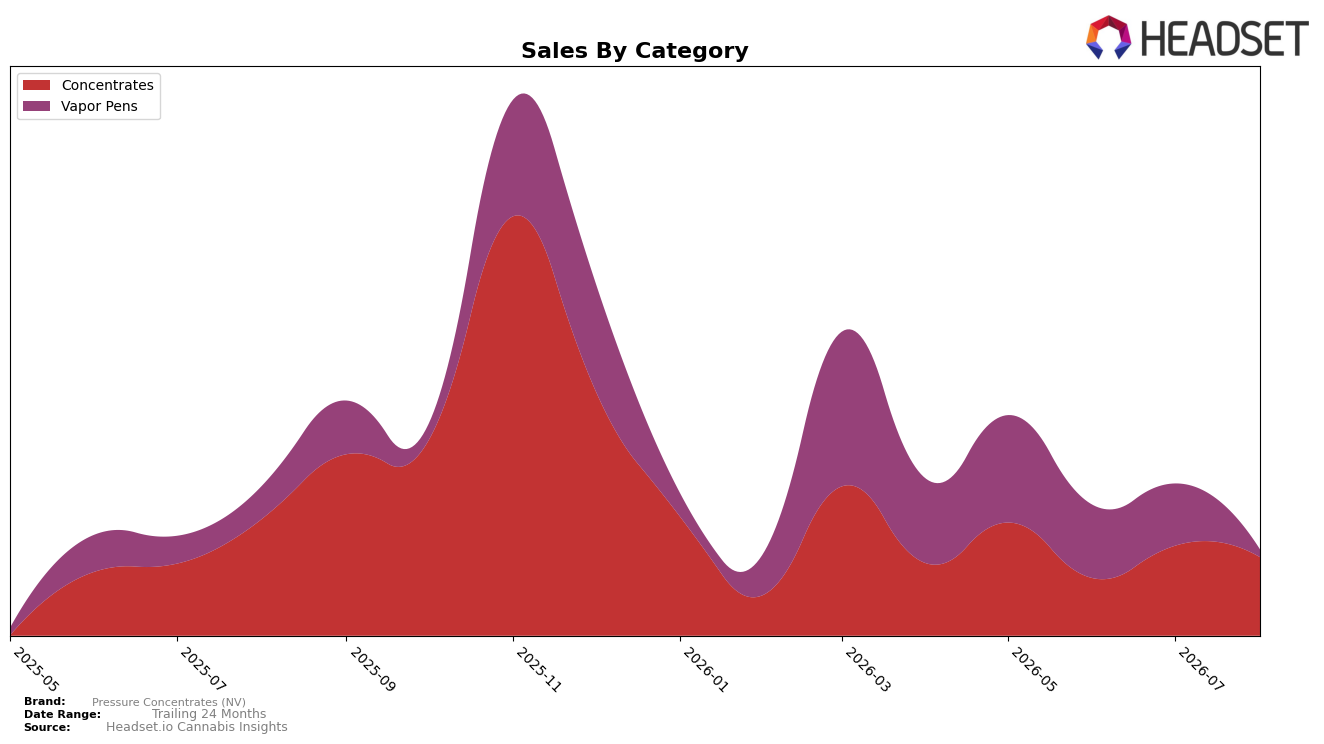
In August 2026, Pressure Concentrates (NV) derived 73.23% of sales from Concentrates and 26.77% from Vapor Pens, a mix weighted toward Concentrates despite a -25.42% year-over-year decline and a -9.32% month-over-month dip in that category; Vapor Pens fell faster at -38.28% year-over-year and -57.17% month-over-month. The brand’s average price moved -4.87% year-over-year to $33.04 while category-level pricing split, with Concentrates averaging $31.33 and Vapor Pens at $38.86, indicating the higher-priced segment contracted volume or distribution more sharply than the core. The combined pattern points to a portfolio that is increasingly concentrated in Concentrates as Vapor Pens compress, and the skew suggests near-term revenue stability rests on mitigating double-digit declines in the lead category while preventing further erosion in the smaller, higher-priced segment.
Within Nevada Concentrates, the brand’s rank at 30 and a -9.32% month-over-month drop alongside a -25.42% year-over-year decline imply share vulnerability if category peers hold steadier trajectories, while the -57.17% month-over-month collapse in Vapor Pens limits cross-category cushion. The divergence between a 73.23% reliance on Concentrates and a 26.77% stake in Vapor Pens, coupled with a -4.87% brand-level price compression, implies positioning as a value-leaning Concentrates player rather than a premium Vapor Pens challenger; to sustain relevance, the brand must either defend Concentrates rank 30 with efficiency gains or rebalance toward segments where price resilience and unit momentum are more achievable.
Competitive Landscape
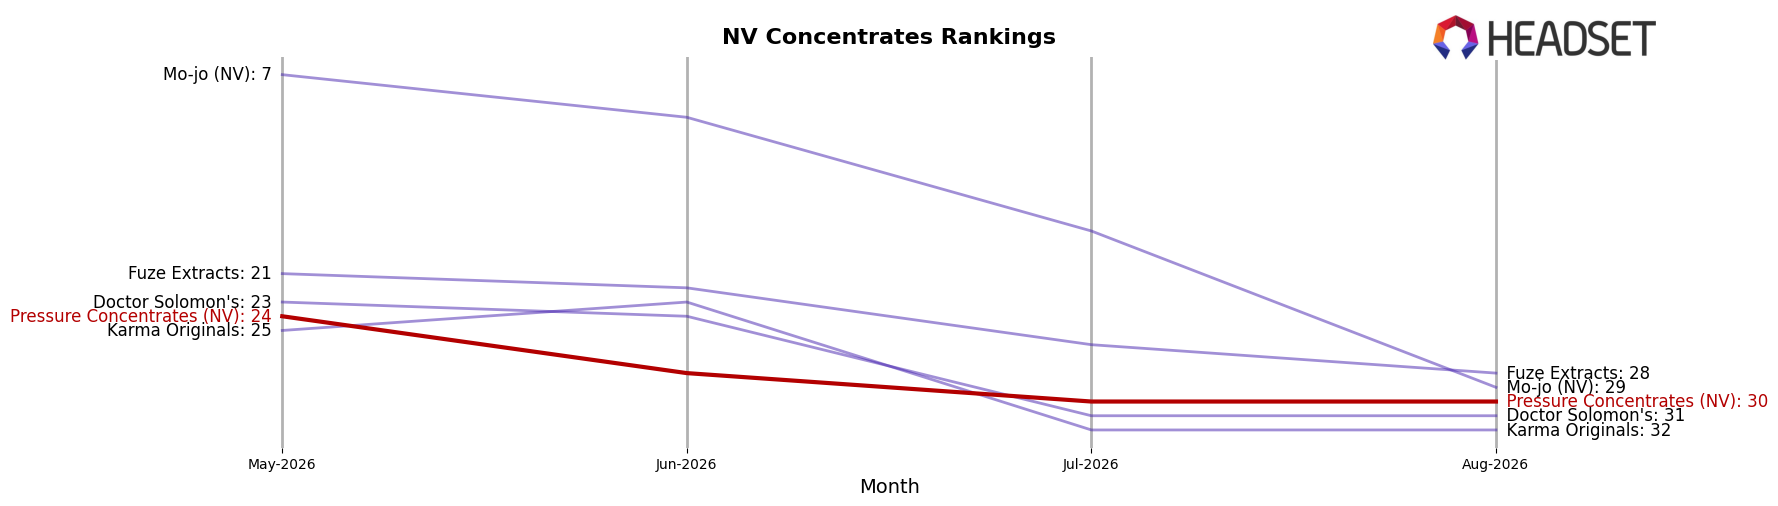
Pressure Concentrates (NV) sits at rank #30 in NV Concentrates in August 2026, a 3-place decline from rank #27 in August 2025, and a 6-place drop from rank #24 in May 2026, while still trailing its peak of #12 in November 2025; by contrast, City Trees advanced from #7 to #3 year over year and Alternative Medicine Association / AMA moved from #3 to #2, indicating that upward mobility among leaders coincided with Pressure Concentrates (NV) sliding down the table. With Medizin holding #1 year over year despite a 42.5% sales decline and Tsunami Labs (NV) improving from #10 to #4, the competitive gap has widened as peers convert rank gains while Pressure Concentrates (NV) gives up rank positions, implying a trajectory toward the lower third of the category unless share recapture reverses the multi-month rank erosion.
Notable Products
Modified Banana Live Rosin Badder (1g) posted the standout move in August 2026 with a +52% month-over-month surge to rank 1, while Legend OG Live Rosin Badder (1g) fell -32% into rank 2; this split implies a rapid pivot toward one hero rosin SKU at the top of the lineup. Zushi Live Resin Disposable (1g) plunged -59% to rank 8 as the only top-10 Vapor Pens entry, whereas Concentrates held ranks 1 through 4 and 6 through 9, indicating the category mix is consolidating away from disposables. Four of the top ten are Live Resin Badder SKUs within Concentrates and two are Live Rosin entries, a concentration that signals the brand is leaning into solventless and badder textures where rank momentum is accruing at the top. The product mix implies Pressure Concentrates (NV) is prioritizing depth in premium Concentrates formats over breadth in Vapor Pens, steering commercial focus toward higher-traction rosin and badder offerings even if it means accepting volatility in pen placements.
Top Selling Cannabis Brands






Data for this report comes from real-time sales reporting by participating cannabis retailers via their point-of-sale systems, which are linked up with Headset’s business intelligence software. Headset’s data is very reliable, as it comes digitally direct from our partner retailers. However, the potential does exist for misreporting in the instance of duplicates, incorrectly classified products, inaccurate entry of products into point-of-sale systems, or even simple human error at the point of purchase. Thus, there is a slight margin of error to consider. Brands listed on this page are ranked in the top twenty within the market and product category by total retail sales volume.

