.svg)

Sep-2026
Sales
Trend
6-Month
Product Count
SKUs
Avg Price
YoY Sales Change
YoY Price Change


Where to Buy
Remedy is stocked at 41 licensed dispensaries across Nevada and Washington, 40 of them in Nevada, with the deepest coverage in Las Vegas, Henderson, Reno, Carson City, and Elko. Search by ZIP code or city below to find the closest one, or filter by product type if you are after a specific format.
Market Insights Snapshot
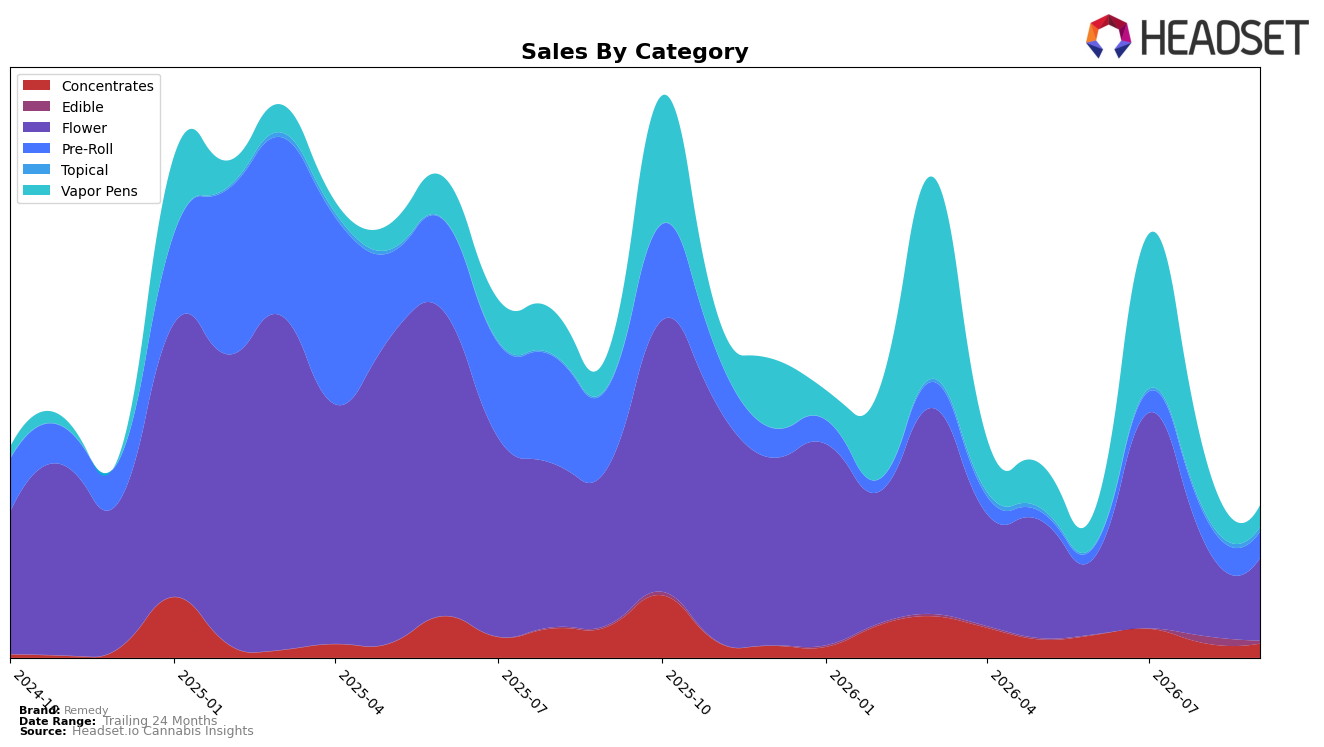
In September 2026, Remedy’s mix remains anchored in Flower at 54.6% share with year-over-year sales down 47.8% and month-over-month down 11.4%, while Pre-Roll holds 17.2% share with a 67.4% YoY decline and a 4.5% MoM pullback; Vapor Pens account for 14.4% share with a 35.2% YoY decline and a steep 62.2% MoM drop. Counterbalancing, Topical expanded to 2.8% share with 256.0% YoY growth and 33.7% MoM growth, and Edible, though just 1.7% share, posted 95.5% YoY growth despite a 61.9% MoM contraction; Concentrates sit at 9.3% share with 55.3% YoY and 2.5% MoM declines. With total brand sales down 50.5% YoY and average price up 32.9% YoY to $26.14, the pattern implies Remedy is relying on pricing and a narrow Flower-heavy base while volatile MoM swings in Vapor Pens and Edible signal unstable replenishment rather than sustained category traction.
These shifts imply Remedy’s positioning is overexposed to Flower cyclicality, where a 59 rank in Flower in Nevada and concurrent 47.8% YoY decline limit discoverability, while simultaneous 62.2% MoM decline in Vapor Pens and 61.9% MoM decline in Edible reduce cross-category capture. The contrasting 256.0% YoY and 33.7% MoM growth in Topical alongside a 4.5% MoM decline in Pre-Roll indicates whitespace in smaller wellness-oriented formats, suggesting Remedy’s near-term leverage comes from nurturing Topical and stabilizing Vapor Pens assortment, rather than chasing incremental share in categories showing double-digit YoY contraction like Concentrates at 55.3% and Pre-Roll at 67.4%.
Competitive Landscape
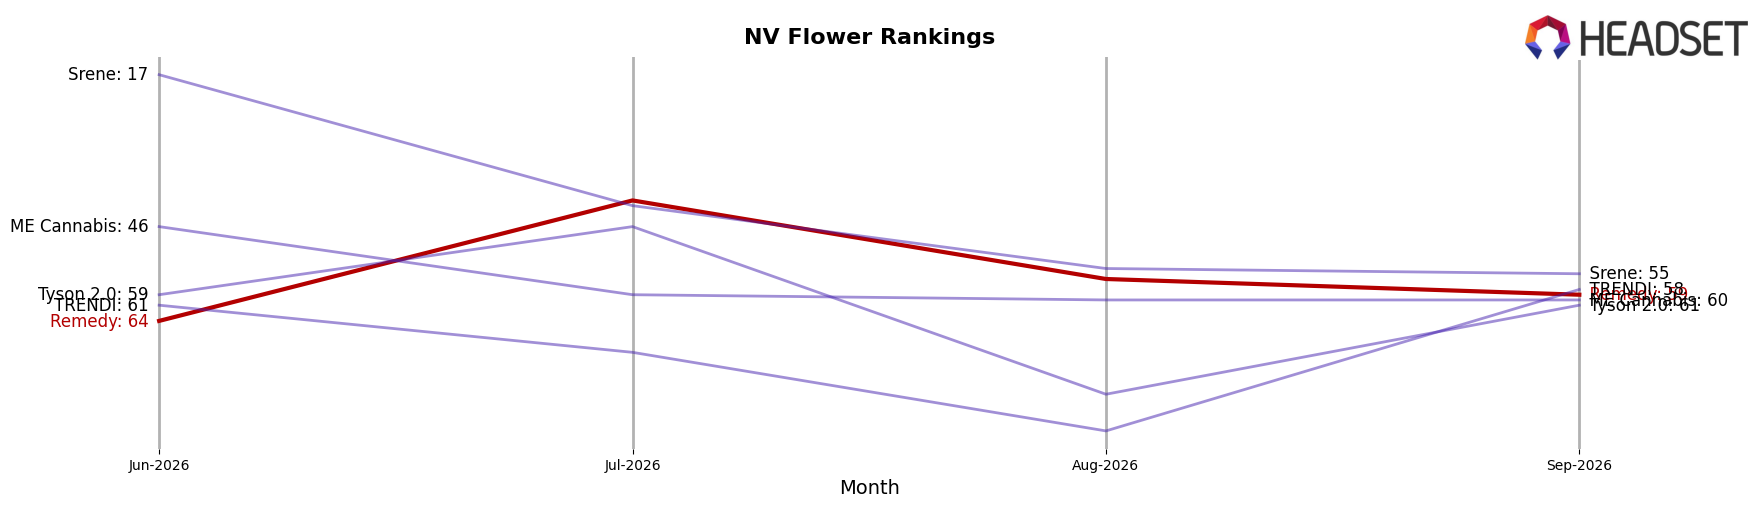
Remedy sits at rank #59 in NV Flower for September 2026, down 4 positions year over year from #55 and up 5 spots versus June 2026’s #64, while still 26 places below its peak of #33 in May 2025; in contrast, RYTHM held #1 with a 19.7% YoY sales increase and STIIIZY maintained #2 with 24.2% YoY growth, as Alternative Medicine Association / AMA advanced from #5 to #3 and Neon Moon climbed from #9 to #4 with 82.7% YoY growth. The combination of a modest quarter-over-quarter rank lift of 7.8% (from #64 to #59) and a 7.3% YoY rank decline indicates Remedy is stabilizing short term but ceding long-run share to faster-rising rivals, implying the trajectory points to a need for category re-entry moves to avoid further mid-tier drift.
Notable Products
Key Lime Pie (3.5g) posted the steepest decline in September 2026 at -21.9% MoM while sliding to rank 3, and Wedding Cake (3.5g) fell -29.9% MoM at rank 4, signaling pressure within Flower even as Las Vegas Kush Cake (3.5g) held rank 2 with a smaller -2.1% pullback. In contrast, Memory Loss Infused Pre-Roll (1g) rose +27.9% MoM to rank 1 and contributed a single-month lift alongside Kush Mints Infused Pre-Roll (1g) at rank 6 with a -10.2% dip, creating a split trajectory between Infused Pre-Rolls and core Flower. Four of the top ten are Flower SKUs while Pre-Rolls occupy ranks 1, 5, and 6, and the top three products together account for approximately $27,100, indicating a pivot where Infused Pre-Rolls buffer declines in flagship Flower and nudge the mix toward higher-velocity format leadership.
Top Selling Cannabis Brands






Data for this report comes from real-time sales reporting by participating cannabis retailers via their point-of-sale systems, which are linked up with Headset’s business intelligence software. Headset’s data is very reliable, as it comes digitally direct from our partner retailers. However, the potential does exist for misreporting in the instance of duplicates, incorrectly classified products, inaccurate entry of products into point-of-sale systems, or even simple human error at the point of purchase. Thus, there is a slight margin of error to consider. Brands listed on this page are ranked in the top twenty within the market and product category by total retail sales volume.

