Jun-2026
Sales
Trend
6-Month
Product Count
SKUs
Avg Price
YoY Sales Change
YoY Price Change
Market Insights Snapshot
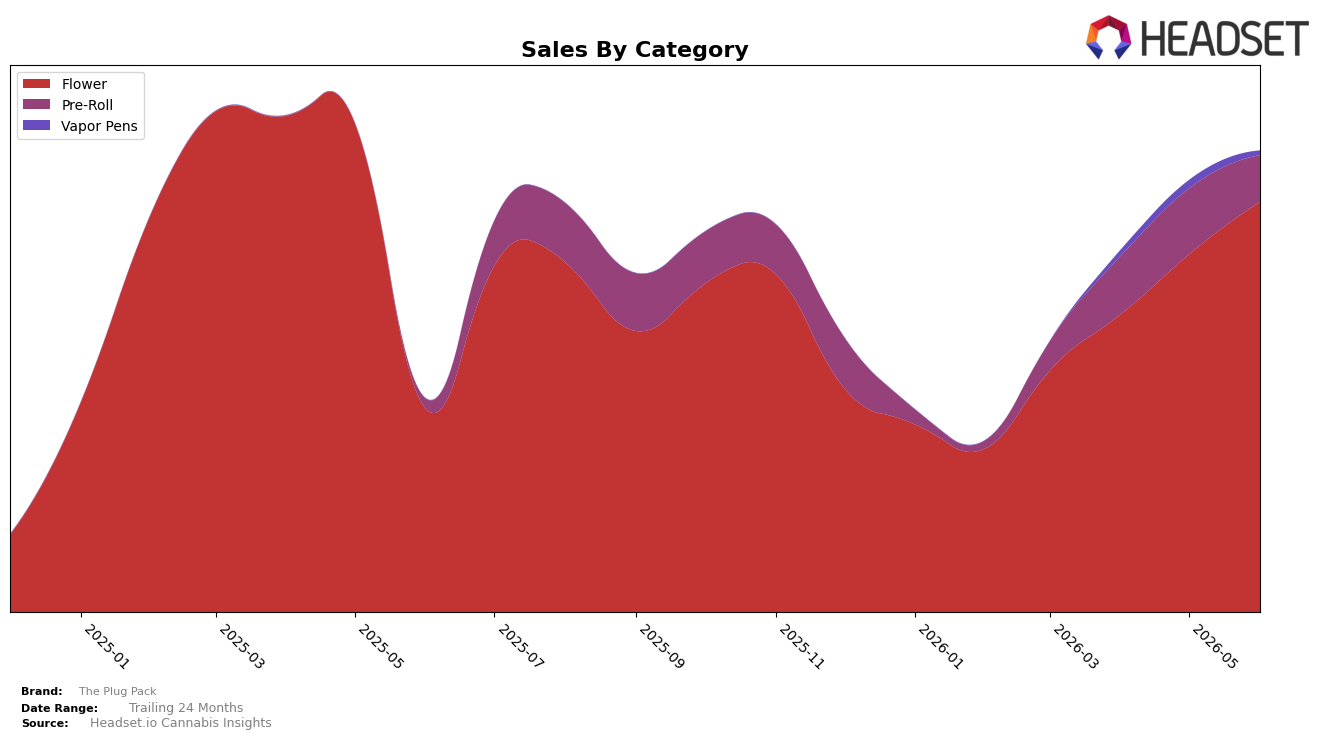
In June 2026, The Plug Pack concentrated 89.01% share in Flower with 101.99% year-over-year growth and 14.65% month-over-month expansion, while Pre-Roll held 10.05% share with 372.40% year-over-year growth but a 29.31% month-over-month decline; Vapor Pens remained a 0.94% sliver with a 46.78% month-over-month drop and no year-over-year baseline. Despite a 42.35% year-over-year decrease in average price to $51.18, overall brand sales rose 116.49% year over year, indicating volume-led expansion concentrated in Flower and punctuated by volatile Pre-Roll swings; the pattern implies a high-dependence mix where June 2026 momentum rides on Flower’s double-digit month-over-month gains while Pre-Roll volatility introduces risk to short-term stability.
The mix concentration around Flower at 89.01% combined with a category rank of 7 in New York Flower suggests mid-tier visibility that benefits from a 14.65% month-over-month lift but is exposed if that pace normalizes; the 29.31% month-over-month pullback in Pre-Roll narrows diversification just as its 372.40% year-over-year rise hints at episodic trial rather than steady repeat. With Vapor Pens at 0.94% share and a 46.78% month-over-month decline, portfolio breadth is thin; taken together, the shifts imply positioning anchored in Flower where price elasticity enabled triple-digit year-over-year brand growth, but sustainable share gains will depend on stabilizing Pre-Roll contribution and preventing further erosion in Vapor Pens.
Competitive Landscape
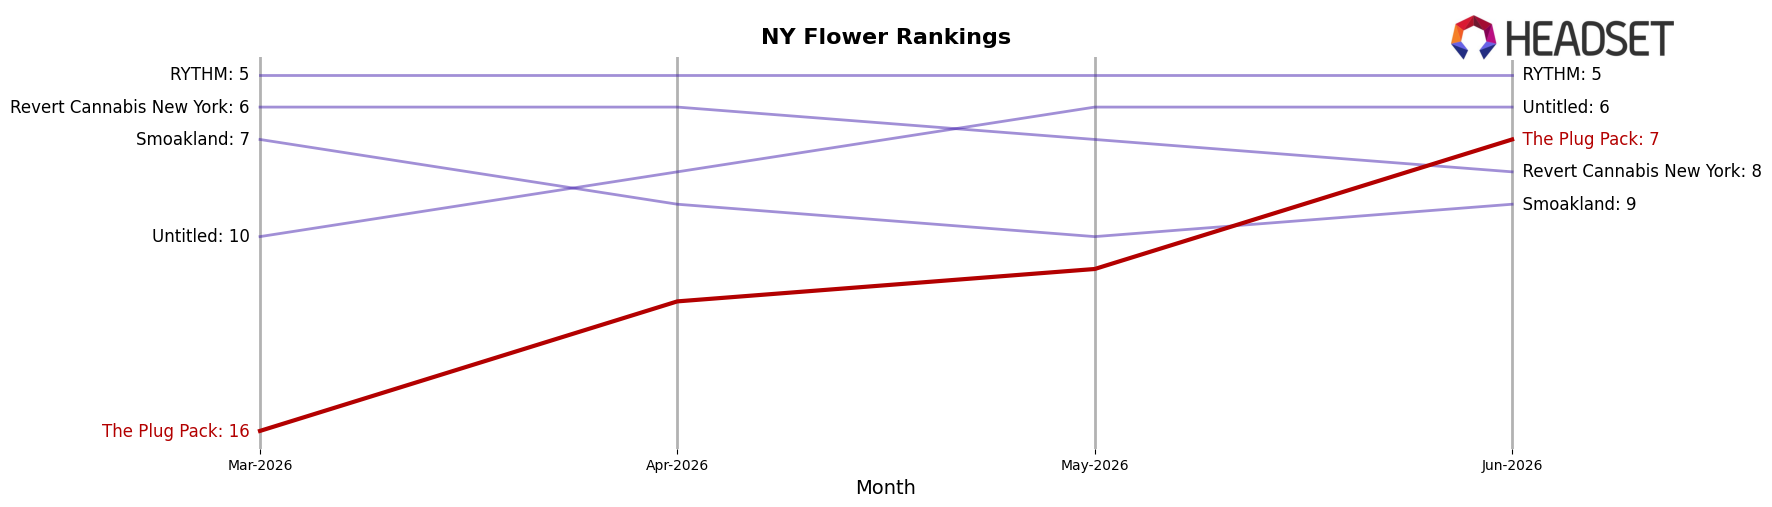
In June 2026, The Plug Pack sits at rank #7 in NY Flower, improving 8 positions YoY from #15 and climbing 9 spots from #16 in March 2026, while still below its peak at #2 in March 2025; meanwhile, Find. rose from #3 to #1 with +35.6% YoY sales and RYTHM advanced from #10 to #5 with +40.6% YoY sales, whereas Dank. By Definition slipped from #1 to #3 alongside a -50.7% YoY sales decline. Against Leal moving from #7 to #2 on +44.4% YoY sales and Rolling Green Cannabis easing from #2 to #4 with -7.1% YoY sales, The Plug Pack’s ascent from #16 in March 2026 to #7 in June 2026 signals momentum concentrated in recent months but still short of category leadership; the trajectory implies a near-term opportunity to consolidate a top-5 position if the current rate of rank gain outpaces peers holding #1–#5.
Notable Products
Lychee Dream Pre-Roll (1g) posted the standout move in June 2026 with a +54.6% month-over-month surge to rank 1, while Cherry Pie Pre-Roll (1g) fell -24.5% to rank 10, marking the steepest decline among top products. Flower showed mixed momentum as Berry Noir (28g) rose +17.1% to rank 3 and Lychee Dream (28g) climbed +19.7% to rank 7, whereas Bomb Pop (28g) in rank 2 slipped -1.1% despite generating $183,811. With six of the top ten coming from Pre-Roll, the category concentration alongside two double-digit Flower risers implies The Plug Pack is shifting toward a barbell mix: premium visibility via surging singles complemented by stable high-volume ounces.
Top Selling Cannabis Brands
Data for this report comes from real-time sales reporting by participating cannabis retailers via their point-of-sale systems, which are linked up with Headset’s business intelligence software. Headset’s data is very reliable, as it comes digitally direct from our partner retailers. However, the potential does exist for misreporting in the instance of duplicates, incorrectly classified products, inaccurate entry of products into point-of-sale systems, or even simple human error at the point of purchase. Thus, there is a slight margin of error to consider. Brands listed on this page are ranked in the top twenty within the market and product category by total retail sales volume.

