.svg)

Sep-2026
Sales
Trend
6-Month
Product Count
SKUs
Avg Price
YoY Sales Change
YoY Price Change


Where to Buy
Mindy's Edibles is stocked at 221 licensed dispensaries across Illinois, Massachusetts, and Ohio, 140 of them in Illinois, with the deepest coverage in Chicago, Quincy, Springfield, Champaign, and East Peoria. Search by ZIP code or city below to find the closest one.
Market Insights Snapshot
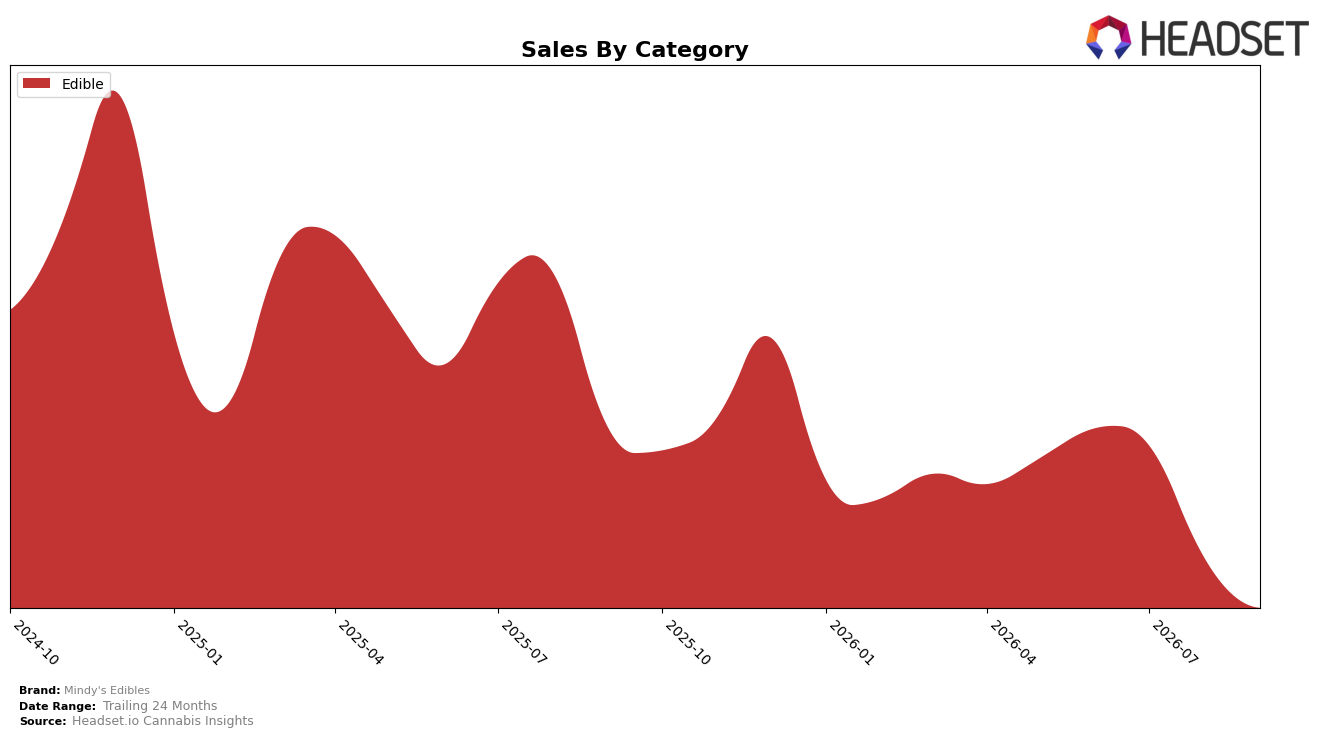
Edible accounted for 100.0% of Mindy's Edibles sales in September 2026, with year-over-year sales down 22.6% and month-over-month sales down 7.4%. Average price declined 7.8% year over year to $15.23, indicating unit mix or discounting pressure alongside share concentration at 100.0%. With an Edible category rank of 16 in Illinois and double-digit declines on both the yearly and monthly comparisons, the pattern implies a single-category dependence that is amplifying downside when category demand or pricing softens.
The combination of a 16th-place rank in Illinois and a 7.8% price drop alongside a 22.6% sales contraction suggests price elasticity is not offsetting volume loss, while the 7.4% month-over-month slide reinforces near-term share erosion within Edibles. With 100.0% of mix tied to Edibles and a 24-month sales change of -31.7%, the brand’s positioning is skewed toward defending a mid-pack slot rather than expanding, implying that diversification or premiumization within Edibles is required to arrest further rank slippage.
Competitive Landscape
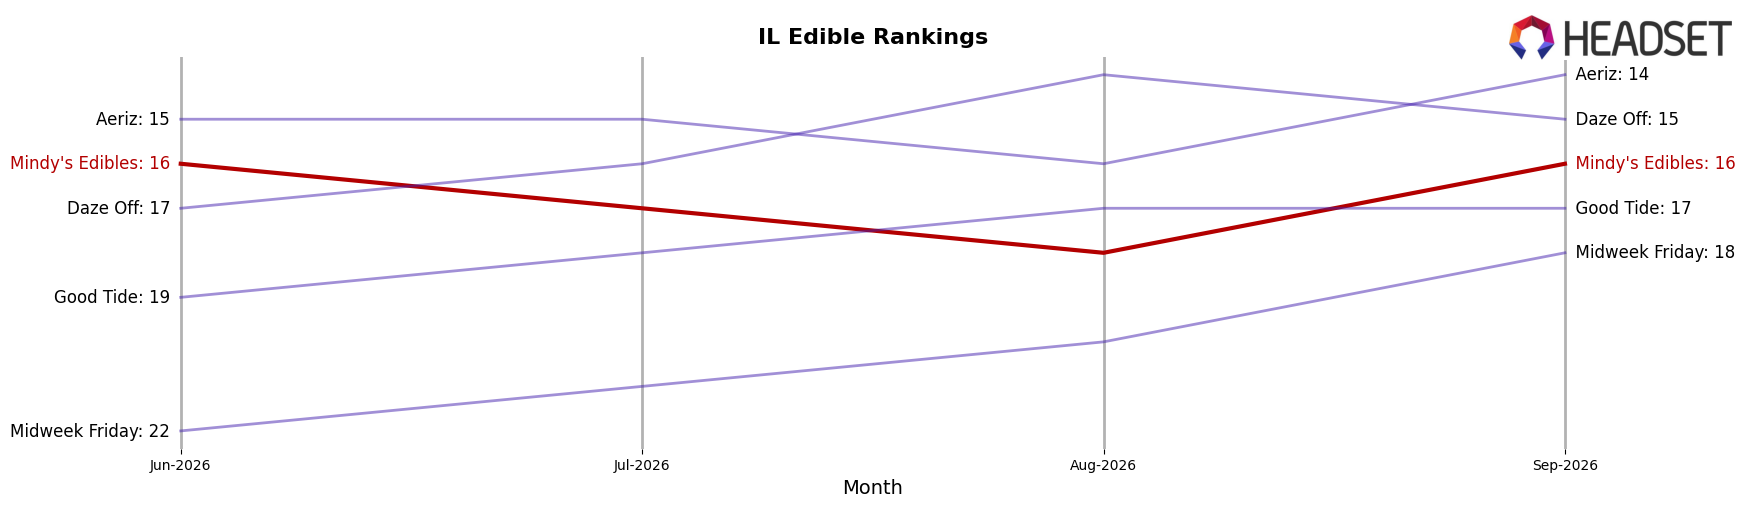
Mindy's Edibles sits at rank #16 in IL Edible for September 2026, down 3 positions from #13 year over year, while holding flat versus June 2026 at #16 and remaining 6 spots below its peak of #10 from December 2024; in contrast, Incredibles advanced from #2 to #1 alongside a 19.5% YoY sales gain and Wyld slipped from #1 to #3 with an 8.0% YoY decline, indicating that Mindy's Edibles is losing relative placement as leadership consolidates at the top and upward mobility now requires displacing brands that are either accelerating or only modestly contracting.
Notable Products
Botanical White Grapefruit Gummies 20-Pack (100mg) posted the steepest decline in September 2026 at -30.6% MoM while sitting at rank 9, and Glazed Clementine Orange Gummies 20-Pack (100mg) fell -14.5% MoM at rank 2, signaling pressure on citrus-forward SKUs despite CBD/THC 1:1 Lush Black Cherry Gummies 20-Pack (100mg CBD, 100mg THC) holding rank 1 with a -3.2% dip. Four of the top ten are 1:1 CBD/THC or lower-dose variants, yet two of those—CBD/THC 1:1 Honey Sweet Melon Gummies 20-Pack (50mg CBD, 50mg THC) at -12.5% MoM and the 100mg version nearly flat at -0.1% MoM—diverge, implying potency-mix sensitivity within the same flavor family. With six of the top ten declining more than -3% MoM and only two new Chocolate entries debuting at ranks 8 and 10 on modest dollars (e.g., $5,760), the portfolio is concentrated in Edibles but tilting away from flavor novelty toward established flagship gummies. The pattern implies Mindy's Edibles is anchored by one high-rank anchor SKU while secondary flavors and lower-dose line extensions require renovation or targeted promotion to stabilize share within Edibles.
Top Selling Cannabis Brands






Data for this report comes from real-time sales reporting by participating cannabis retailers via their point-of-sale systems, which are linked up with Headset’s business intelligence software. Headset’s data is very reliable, as it comes digitally direct from our partner retailers. However, the potential does exist for misreporting in the instance of duplicates, incorrectly classified products, inaccurate entry of products into point-of-sale systems, or even simple human error at the point of purchase. Thus, there is a slight margin of error to consider. Brands listed on this page are ranked in the top twenty within the market and product category by total retail sales volume.

