Jun-2026
Sales
Trend
6-Month
Product Count
SKUs
Avg Price
YoY Sales Change
YoY Price Change
Market Insights Snapshot
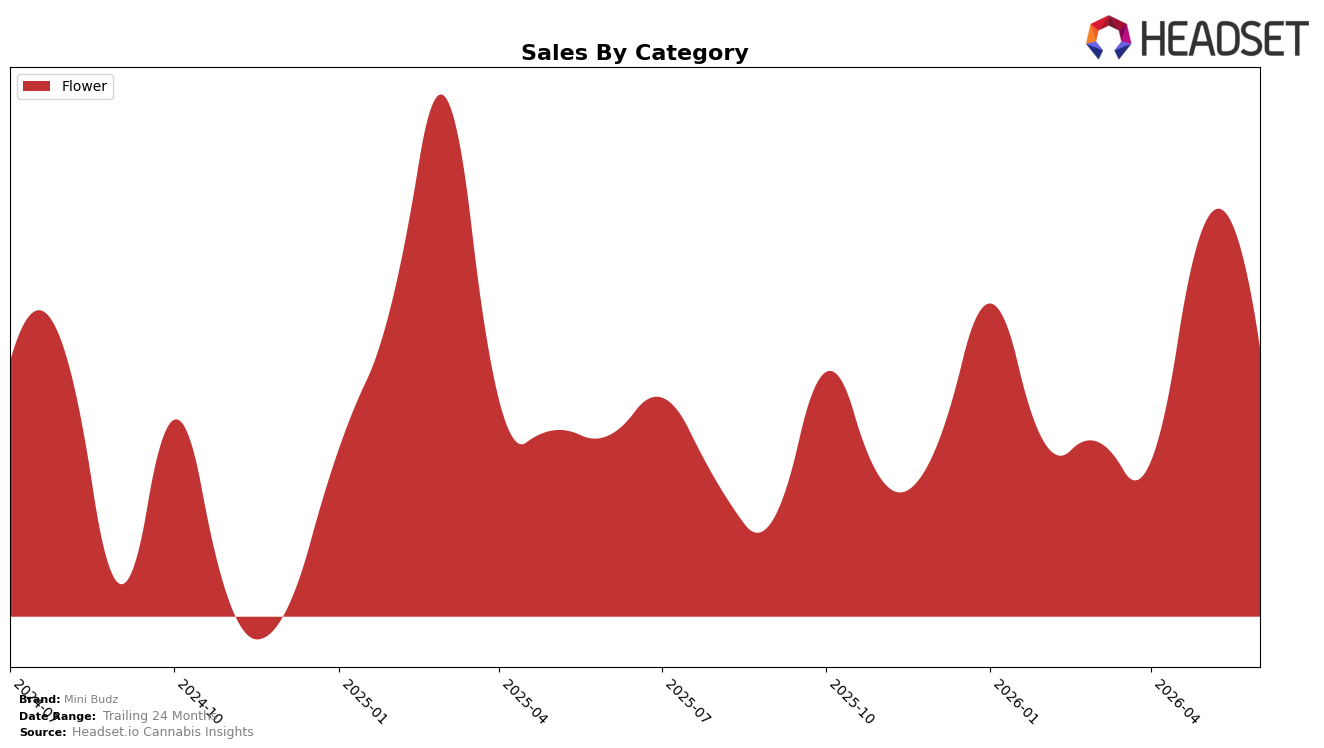
In June 2026, Mini Budz operated as a single-category brand with Flower at 100.0% mix, pairing a 17.3% year-over-year sales increase with a -17.2% month-over-month pullback, while average price fell -12.2% YoY to $17.95. Within Washington Flower, the brand sat at rank 18, indicating share stability YoY alongside intra-quarter volatility MoM; the pattern implies a reliance on a single revenue engine that benefits from annual demand but is exposed to monthly swings tied to pricing and promotional cadence.
The combination of a 100.0% Flower mix and an 18th-place ranking suggests positioning concentrated in value-access tiers, where a -12.2% YoY price move likely financed the 17.3% YoY sales lift even as MoM sales fell -17.2% when discount intensity eased. This setup implies Mini Budz is trading price for velocity in Flower rather than diversifying its category footprint, meaning future share gains will hinge on sustaining sub-$18 price cues and smoothing month-to-month demand shocks without diluting rank momentum in Washington Flower.
Competitive Landscape
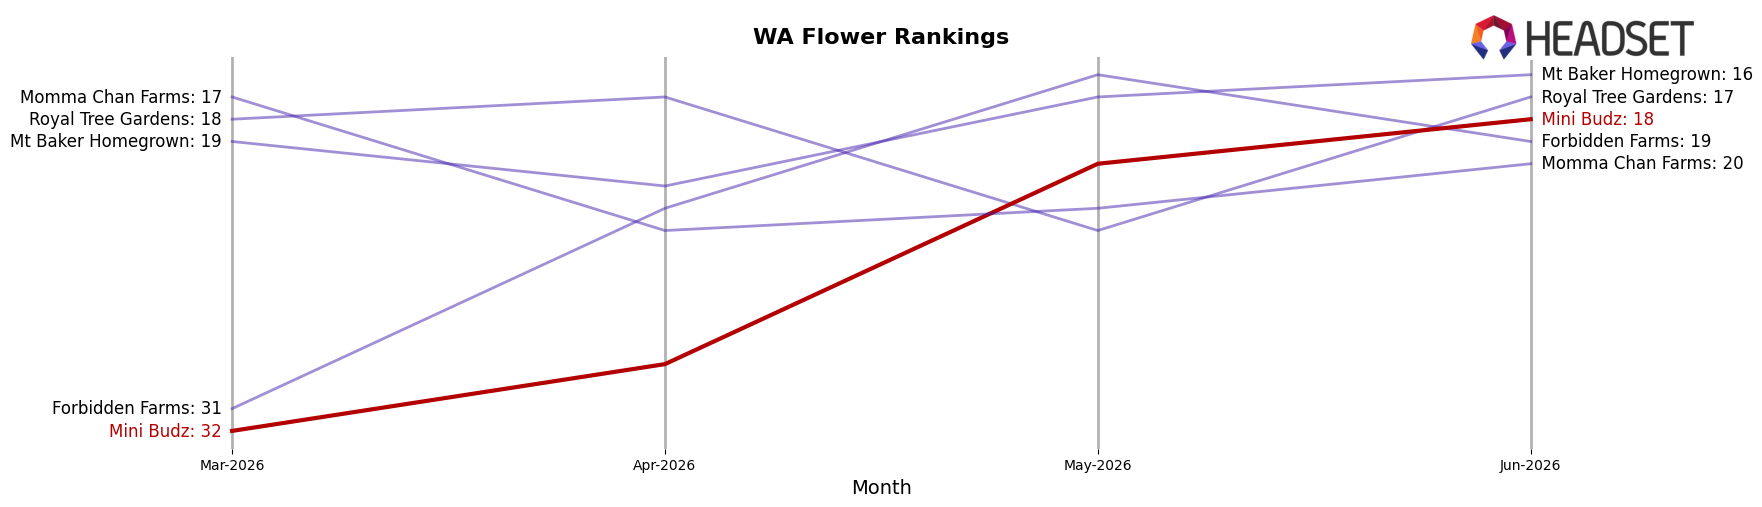
Mini Budz sits at rank #18 in Washington Flower in June 2026, improving 6 positions year over year from #24 while climbing 14 spots since March 2026 from #32, and it remains one notch below its historical peak of #17 from January 2025. Against market leaders, Phat Panda held #1 with a 16.6% year-over-year sales increase while Legends stayed at #2 despite a 19.8% year-over-year decline, indicating Mini Budz’s rank gains are occurring as at least one top competitor gives ground; meanwhile, Lifted Cannabis Co advanced from #8 to #3 alongside a 17.9% year-over-year sales lift, suggesting Mini Budz must convert its 6-rank YoY improvement and 14-rank spring rebound into sustained share capture before faster-moving climbers widen the gap.
Notable Products
Skunk Mini Budz (3.5g) posted the steepest decline at -36.9% month over month while Georgia Pie Popcorn (3.5g) rose 50.3%, with the latter sitting at rank 3 and the former at rank 9. Marz Popcorn (3.5g) held rank 1 as the top SKU, and five Popcorn-format SKUs sit within the top 10, indicating a concentration in value-oriented Flower. The split between a -36.9% drop and a +50.3% surge within adjacent formats implies Mini Budz is tilting mix toward fast-moving Popcorn cuts while pruning underperforming Mini Budz lines to defend share at the top of the ranking.
Top Selling Cannabis Brands
Data for this report comes from real-time sales reporting by participating cannabis retailers via their point-of-sale systems, which are linked up with Headset’s business intelligence software. Headset’s data is very reliable, as it comes digitally direct from our partner retailers. However, the potential does exist for misreporting in the instance of duplicates, incorrectly classified products, inaccurate entry of products into point-of-sale systems, or even simple human error at the point of purchase. Thus, there is a slight margin of error to consider. Brands listed on this page are ranked in the top twenty within the market and product category by total retail sales volume.

