Jun-2026
Sales
Trend
6-Month
Product Count
SKUs
Avg Price
YoY Sales Change
YoY Price Change
Market Insights Snapshot
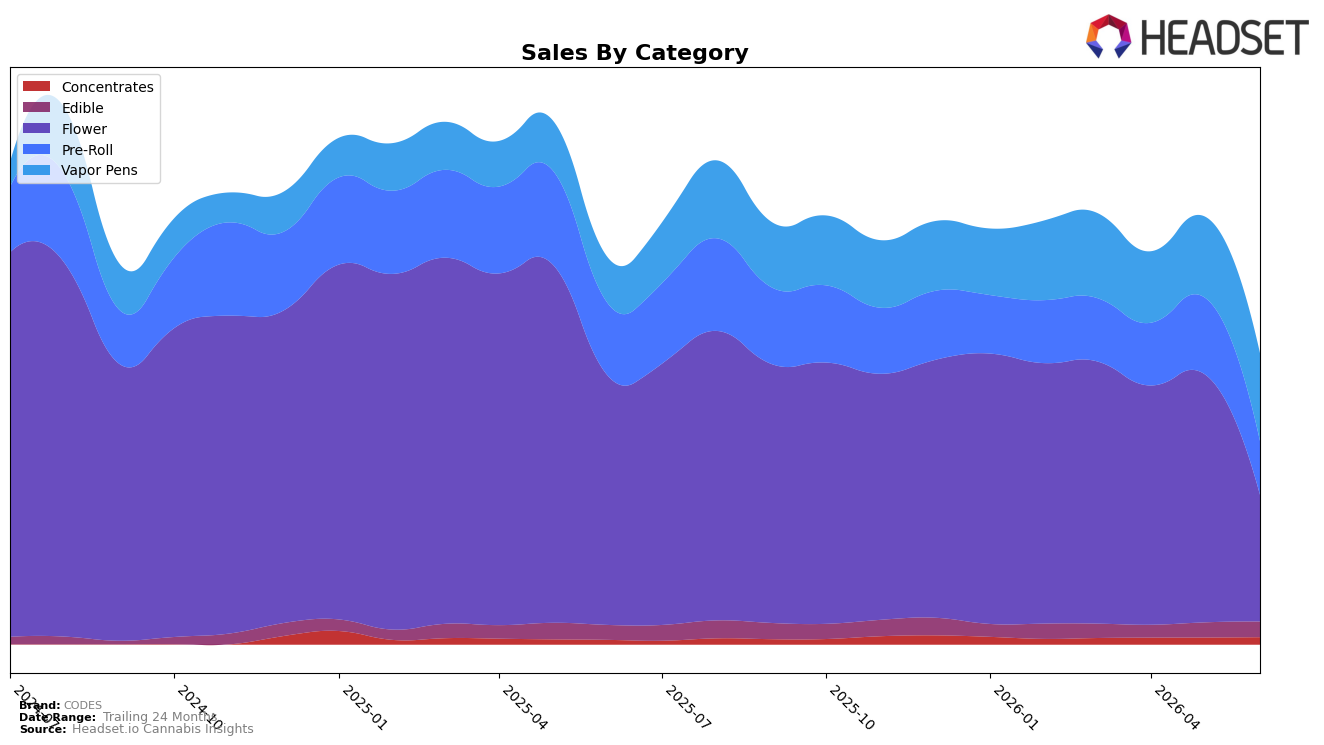
In June 2026, CODES shifted its mix toward non-Flower formats as Flower fell to 43.59% share with a year-over-year decline of 49.16% and a month-over-month decline of 49.04%, while Vapor Pens expanded to 30.19% share on 91.92% YoY growth and 8.36% MoM growth. Pre-Roll contracted to 18.47% share with YoY down 25.56% and MoM down 29.91%, whereas Edible inched up to 5.28% share with 5.22% YoY growth and 3.69% MoM growth, and Concentrates reached 2.47% share with 59.61% YoY growth and 4.55% MoM growth. With total brand sales down 24.72% YoY and average price down 9.01%, the pattern implies CODES is reallocating demand from Flower into higher-growth inhalables, which reduces reliance on a declining anchor category while accepting lower Pre-Roll velocity.
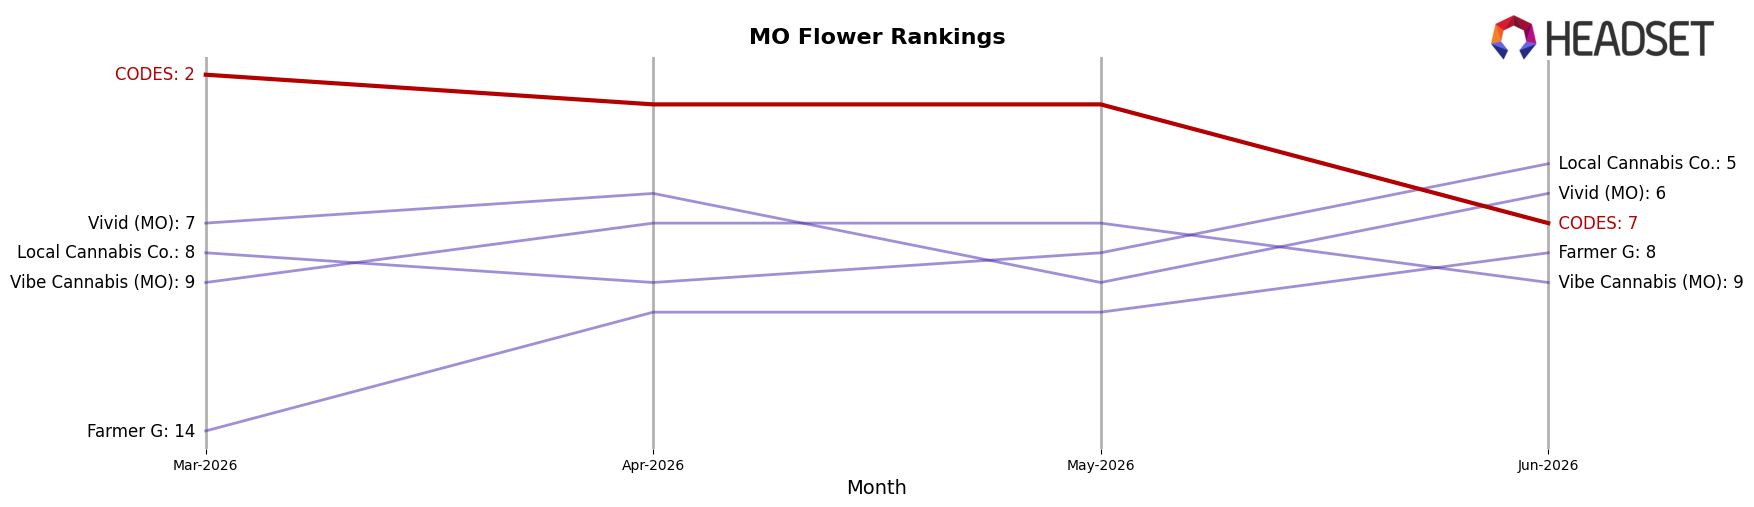
The mix reweighting implies a positioning pivot toward devices and processed formats: Vapor Pens’ 91.92% YoY and 8.36% MoM gains, alongside Concentrates’ 59.61% YoY and 4.55% MoM gains, suggest capability and assortment depth are starting to offset Flower’s 49.16% YoY and 49.04% MoM drops. Given CODES’s June 2026 Flower rank of 7 in Missouri and the category’s contraction within the brand, sustaining share likely depends on leaning into Vapor Pens’ 30.19% share while stabilizing Pre-Roll’s 18.47% share after a 29.91% MoM decline. The implication is that CODES’s defensible footprint now rests on differentiated non-Flower propositions, with pricing and portfolio choices tuned to keep basket size resilient despite the 9.01% average price decrease.
Competitive Landscape
CODES sits at rank #7 in Missouri Flower in June 2026, down 5 positions year over year from #2, after previously peaking at #1 in August 2024 and falling 5 spots from March 2026’s #2 to June 2026’s #7, while category leaders shifted with Flora Farms holding #1 despite a -5.1% YoY sales change and Sinse Cannabis climbing from #7 to #2 alongside a 33.2% YoY sales increase; this pattern implies CODES has ceded velocity to faster risers and now needs a share-recovery move to avoid further mid-pack drift.
Notable Products
With no June 2026 SKU posting a month-over-month swing beyond ±50%, the headline is stability at the top: The Code- Tangie Berry BDT Distillate Disposable (1g) held rank 1 with +22.2% MoM while The Code- Lime Smoothie Ice BDT Distillate Disposable (1g) sat at rank 4 with +12.6% MoM, and The Code- Peach Parfait Distillate Disposable (1g) entered at rank 2 with no comparable MoM trend available. Vapor Pens dominate concentration as four of the top ten are Vapor Pen SKUs occupying ranks 1, 2, 3, and 4, and the next closest category presence—Pre-Roll—does not appear until ranks 5 and 7, implying wallet share is tilting toward inhalables. The Code - Mango Cream BDT Distillate Disposable (1g) placed at rank 8 against a $291,118 leader at rank 1, creating a wide intra-category spread that aligns with a two-tiered pen portfolio. The pattern implies CODES is consolidating around flavored BDT pens as its commercial spine while using Pre-Roll and Edible SKUs as secondary traffic drivers rather than growth engines.
Top Selling Cannabis Brands
Data for this report comes from real-time sales reporting by participating cannabis retailers via their point-of-sale systems, which are linked up with Headset’s business intelligence software. Headset’s data is very reliable, as it comes digitally direct from our partner retailers. However, the potential does exist for misreporting in the instance of duplicates, incorrectly classified products, inaccurate entry of products into point-of-sale systems, or even simple human error at the point of purchase. Thus, there is a slight margin of error to consider. Brands listed on this page are ranked in the top twenty within the market and product category by total retail sales volume.

