Jun-2026
Sales
Trend
6-Month
Product Count
SKUs
Avg Price
YoY Sales Change
YoY Price Change
Market Insights Snapshot
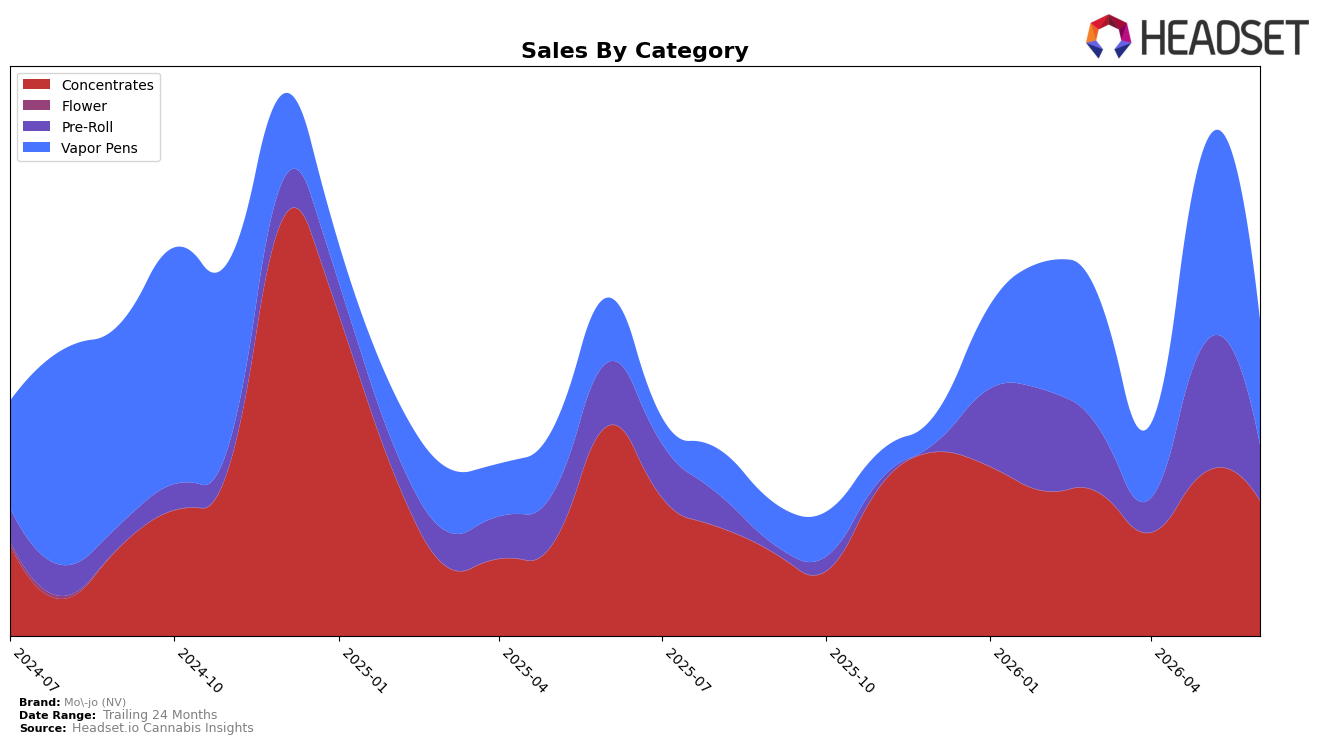
Mo-jo (NV) concentrated 42.79% of June 2026 sales in Concentrates with a year-over-year decline of 35.75% and a month-over-month drop of 17.30%, while Vapor Pens held 39.59% share with a 94.42% year-over-year increase but a 36.71% month-over-month contraction; Pre-Roll comprised 17.62% share, falling 12.15% year-over-year and 56.89% month-over-month. Despite an overall brand sales decline of 6.56% year-over-year alongside a 43.33% year-over-year average price increase to $26.29, the mix shifted toward Vapor Pens on an annual basis yet contracted sharply month-over-month, implying Mo-jo (NV) is balancing high-price realization with volume volatility and is exposed to short-cycle swings across all three categories.
Holding rank 11 in Concentrates in Nevada while Concentrates dropped 35.75% year-over-year and 17.30% month-over-month suggests mid-tier placement that could slide if the category contraction persists; at the same time, Vapor Pens’ 94.42% year-over-year growth and 39.59% share indicate headroom to translate annual gains into steadier monthly sell-through despite the 36.71% month-over-month retreat. With Pre-Roll’s 56.89% month-over-month decline and 17.62% share, the portfolio is leaning on two categories with divergent trajectories, implying Mo-jo (NV) should anchor positioning around Concentrates credibility (rank 11) while reallocating activation to stabilize Vapor Pens’ month-to-month demand to offset Concentrates softness.
Competitive Landscape
Mo-jo (NV) sits at rank #11 in NV Concentrates for June 2026, down 5 positions from #6 year over year and up 1 spot from #12 in March 2026, while its historical peak was #4 in January 2025; in contrast, Medizin held #1 both year over year and in June 2026 despite a -37.0% sales change, and Nature's Chemistry advanced from #13 year over year to #4 with +102.0% sales growth. Compared with City Trees steadying at #3 despite a -41.2% sales decline and Alternative Medicine Association / AMA maintaining #2 while posting -29.7%, Mo-jo (NV)’s drop from a #4 peak to #11 suggests a share reallocation toward faster-rising competitors rather than broad category expansion, implying that regaining rank will require outperforming incumbents whose positions have proven durable even amid double-digit percentage contractions.

Notable Products
Pineapple OG Live Resin Crumble (0.05g) posted the steepest move in June 2026 with a -64.6% month-over-month drop while sitting at rank 8, contrasting with Zodiac Killer Distillate Cartridge (1g) at rank 1 despite a -20.3% decline. Afghani Distillate Disposable (1g) fell -13.0% at rank 5 and Jack Herer Distillate Disposable (1g) slid -15.0% at rank 9, and five of the top ten are Vapor Pens SKUs, indicating concentration in one inhalable format. The Joysticks - Oh Geez Pre-Roll 14-Pack (14g) held rank 4 with $8,949 in June 2026 sales while The Jam Distillate Cartridge (1g) occupied rank 3, placing non-pen formats mostly below the top three even as the leading pen contracted. The pattern implies Mo-jo (NV) is leaning on a narrow Vapor Pens portfolio that is softening at the top, suggesting a need to fortify pen retention while reallocating attention to stabilize concentrates.
Top Selling Cannabis Brands
Data for this report comes from real-time sales reporting by participating cannabis retailers via their point-of-sale systems, which are linked up with Headset’s business intelligence software. Headset’s data is very reliable, as it comes digitally direct from our partner retailers. However, the potential does exist for misreporting in the instance of duplicates, incorrectly classified products, inaccurate entry of products into point-of-sale systems, or even simple human error at the point of purchase. Thus, there is a slight margin of error to consider. Brands listed on this page are ranked in the top twenty within the market and product category by total retail sales volume.

