May-2026
Sales
Trend
6-Month
Product Count
SKUs
Avg Price
YoY Sales Change
YoY Price Change
Market Insights Snapshot
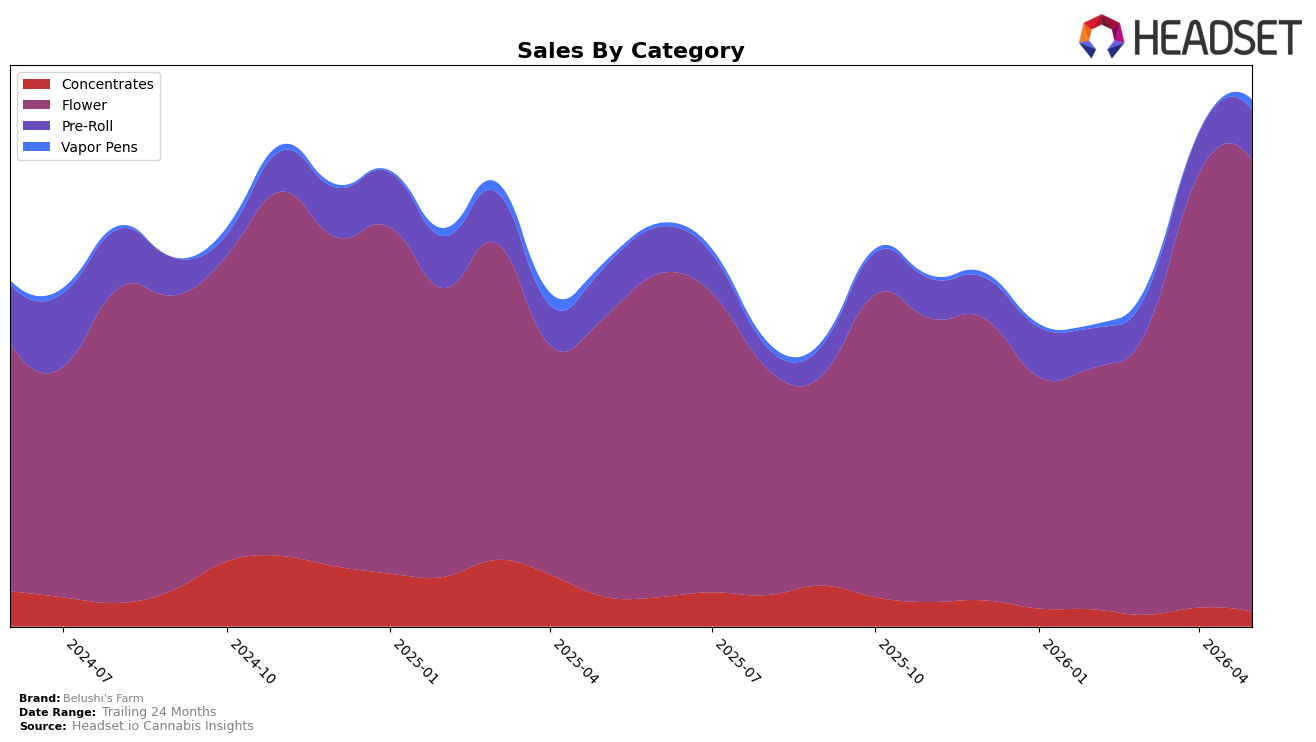
Belushi's Farm concentrated 83.70% of May 2026 sales in Flower, where year-over-year growth reached 61.40% and month-over-month rose 3.99%, while Pre-Roll held 10.13% share with a 0.90% year-over-year uptick and a 21.04% month-over-month jump. Vapor Pens remained a small 2.68% share but surged 197.39% month-over-month alongside a 58.31% year-over-year rise, contrasting with Concentrates at 3.50% share that declined 44.24% year-over-year and 17.37% month-over-month; combined with a 25.01% increase in average price and a 43.15% brand-level year-over-year sales lift, the mix indicates pricing power anchored in Flower volume. With Flower as the top category and a rank of 28 in Ohio Flower, the pattern implies a scale-first model driven by premiumized Flower and opportunistic adjacency growth rather than balanced diversification.
The outsized reliance on Flower (83.70% share) paired with Pre-Roll’s 21.04% month-over-month acceleration and Vapor Pens’ 197.39% month-over-month spike suggests Belushi's Farm is extending trial from its Flower base into lower-basket and convenient formats without diluting core positioning. Given Concentrates’ 44.24% year-over-year decline and the brand’s 27.60% two-year growth alongside a 58.31% year-over-year rise in Vapor Pens, the brand appears to be reallocating attention toward categories that convert Flower equity into easier entry points; holding rank 28 in Ohio Flower implies headroom if Pre-Roll and Vapor Pens funnel consumers back to higher-priced Flower, making the thesis that cross-format halo, not category breadth, is the near-term growth lever.
Competitive Landscape
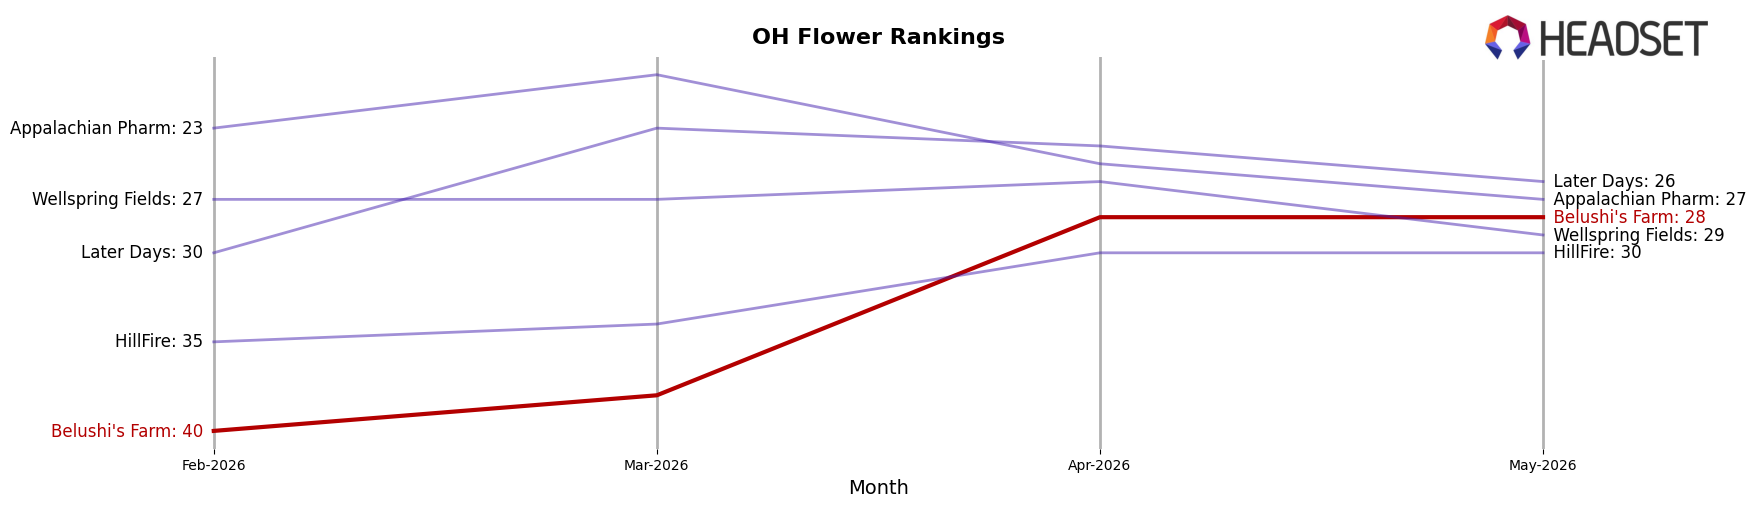
Belushi's Farm sits at rank #28 in May 2026, improving 21 positions from #49 year over year and climbing 12 places from #40 since February 2026; this marks a new peak at #28 in May 2026 while still trailing the top 25 by three spots. Against the market’s leaders, RYTHM moved up from #7 to #2 with a 49.2% YoY sales increase and Klutch Cannabis surged from #16 to #3 with 161.1% YoY growth, whereas Riviera Creek held #1 while posting a -10.1% YoY sales change and Buckeye Relief slipped from #1 to #5 with a -31.3% YoY decline; this mix implies that Belushi's Farm’s rank gains are happening amid rotation at the top, suggesting headroom to convert recent momentum into a top-20 push if distribution or pricing closes the three-rank gap to the next tier.
Notable Products
Muul Fuel (2.83g) posted the steepest movement in May 2026 with a -71.6% month-over-month drop and slid to rank 7, while Cadillac Rainbows (3.5g) fell -15.7% to rank 8, signaling volatility within mid-table Flower formats. In contrast, Mule Fuel (3.5g) surged +84.7% and reached rank 5, and Hash Burger (2.83g) rose +11.8% to hold rank 1, indicating that gains are concentrated at the top even as a key mid-tier SKU retrenches. With eight of the top ten SKUs in Flower and only two Pre-Rolls in the mix, the portfolio skews toward Flower leadership, implying Belushi's Farm is consolidating around fewer, higher-velocity Flower offerings while pruning or repositioning underperforming sizes.
Top Selling Cannabis Brands
Data for this report comes from real-time sales reporting by participating cannabis retailers via their point-of-sale systems, which are linked up with Headset’s business intelligence software. Headset’s data is very reliable, as it comes digitally direct from our partner retailers. However, the potential does exist for misreporting in the instance of duplicates, incorrectly classified products, inaccurate entry of products into point-of-sale systems, or even simple human error at the point of purchase. Thus, there is a slight margin of error to consider. Brands listed on this page are ranked in the top twenty within the market and product category by total retail sales volume.

