.svg)
Aug-2026
Sales
Trend
6-Month
Product Count
SKUs
Avg Price
YoY Sales Change
YoY Price Change


Where to Buy
Monster Xtracts is stocked at 245 licensed dispensaries across Michigan, with the deepest coverage in Detroit, Grand Rapids, New Buffalo, Lansing, and Monroe. Search by ZIP code or city below to find the closest one, or filter by product type if you are after a specific format.
Market Insights Snapshot
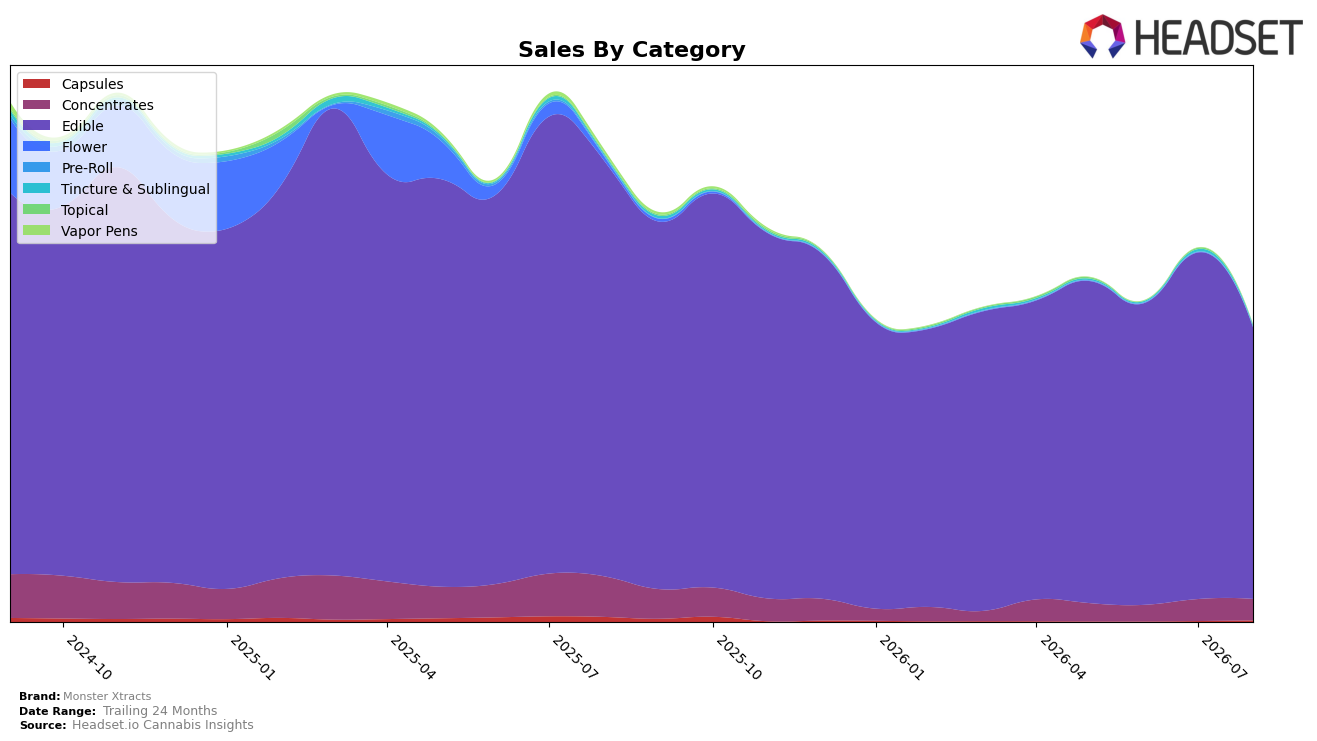
In August 2026, Monster Xtracts remained concentrated in Edible at 92.07% share while Concentrates held 7.17%, placing Edible at rank 11 in Michigan Edible. Edible sales declined 34.97% year over year and 22.01% month over month, while Concentrates fell 47.60% YoY but only 2.50% MoM, signaling a sharper annual retreat but near-term stabilization outside the core. The long tail was volatile: Capsules rose 118.49% MoM despite a 75.34% YoY drop and just 0.39% share, whereas Tincture & Sublingual fell 50.66% MoM and 25.76% YoY and Topical contracted 88.96% MoM and 87.12% YoY, together contributing only 0.37% share. With brand sales down 37.50% YoY and average price down 12.40% YoY to $3.38, the mix implies overexposure to a contracting Edible base and a need to leverage categories with milder MoM declines to buffer rank pressure in Edible at position 11.
The steep 22.01% MoM drop in Edible alongside a 2.50% MoM dip in Concentrates suggests incremental resilience where price points are higher (average price $14.81 in Concentrates vs $3.17 in Edible), indicating that value compression in Edible may be diluting revenue more than unit demand. The 118.49% MoM rebound in Capsules off a 0.39% share base and the 50.66% MoM contraction in Tincture & Sublingual reveal tactical, not structural, volume—useful for targeted promos but insufficient to offset a 92.07% Edible mix. The pattern implies that maintaining rank 11 in Michigan Edible will depend on rebalancing a few share points toward Concentrates to counter a 34.97% Edible YoY decline, while stabilizing Edible price architecture to slow the 12.40% YoY price erosion that compounds category-driven revenue pressure.
Competitive Landscape
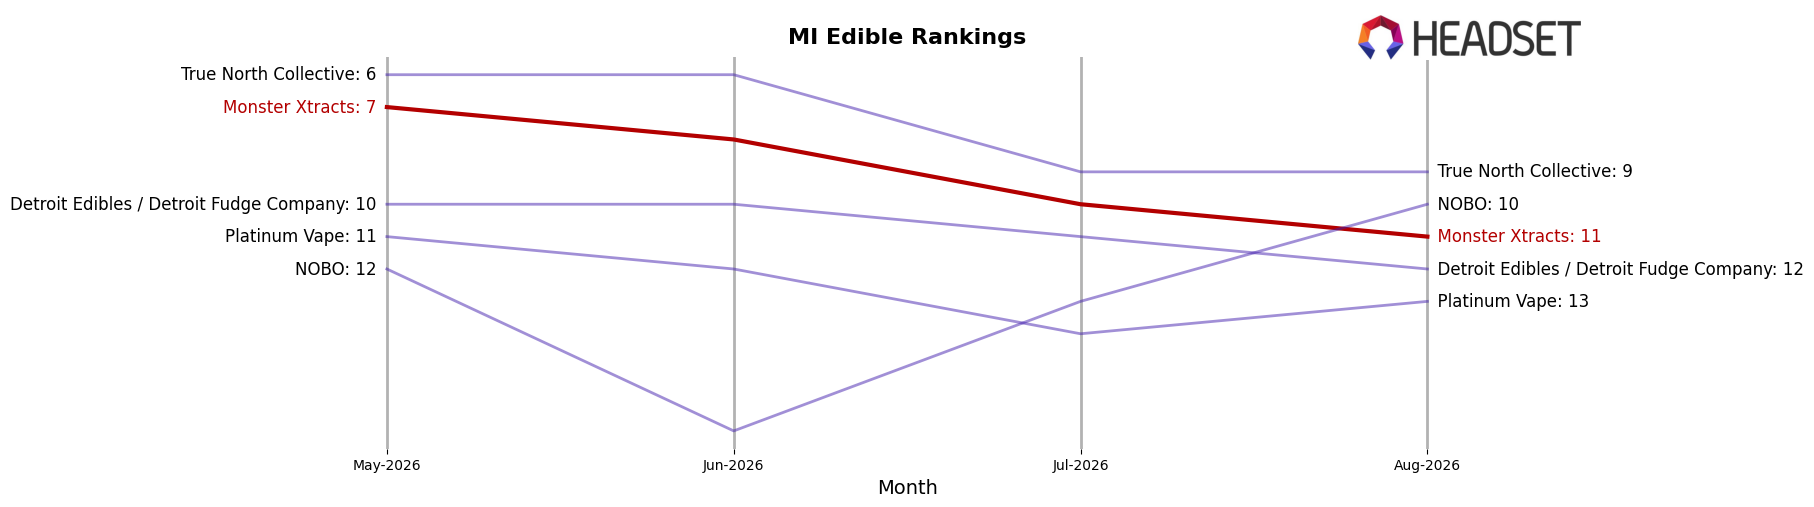
Monster Xtracts sits at rank #11 in MI Edible for August 2026, down 5 positions year over year from #6, and 4 spots lower than its May 2026 position at #7; against that backdrop, Wyld holds #1 despite a 22.8% year-over-year sales decline while Camino moved up from #4 to #3 with 22.1% year-over-year growth. Compared to its category peak of #4 in March 2025, Monster Xtracts is 7 ranks below peak and 9 ranks behind current leader Wyld, while Play Cannabis advanced from #11 to #5 with 22.7% year-over-year growth, signaling that Monster Xtracts’ downward rank shift amid mixed competitor momentum implies share is being ceded to faster risers even as top-tier incumbents soften.
Notable Products
Hybrid Cherry Bomb Single Blaster Naut Gummy (200mg) posted the steepest decline in August 2026 at -33.7% while sliding to rank 3, as Indica Blue Razz Bang! Single Blaster Naut Gummy (200mg) dropped -21.2% at rank 2. In contrast, Tropical Thunder Blaster Naut Gummy (200mg) rose +32.0% to rank 1, widening the gap at the top and concentrating share in a single leader. With eight of the top ten SKUs in the Edible set coming from the Blaster Naut and Monster Medibles families, the mix is consolidating around gummies with one breakout leader and secondary SKUs retrenching, implying Monster Xtracts is tilting toward a flagship-first gummy strategy with selective pruning of lagging variants.
Top Selling Cannabis Brands






Data for this report comes from real-time sales reporting by participating cannabis retailers via their point-of-sale systems, which are linked up with Headset’s business intelligence software. Headset’s data is very reliable, as it comes digitally direct from our partner retailers. However, the potential does exist for misreporting in the instance of duplicates, incorrectly classified products, inaccurate entry of products into point-of-sale systems, or even simple human error at the point of purchase. Thus, there is a slight margin of error to consider. Brands listed on this page are ranked in the top twenty within the market and product category by total retail sales volume.

