Market Insights Snapshot
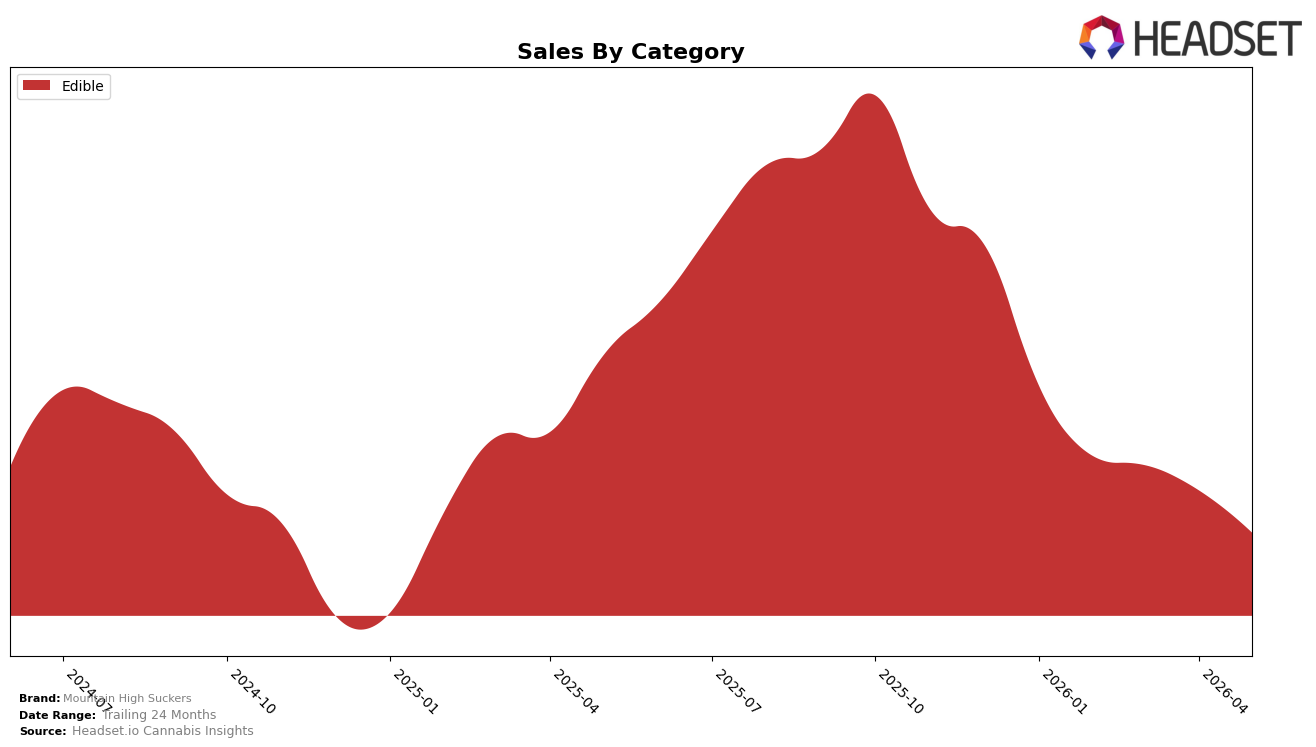
In May 2026, Mountain High Suckers operated as a single-category brand, with Edible accounting for 100.0% of sales and a category rank of 30 in Colorado. Within Edible, sales declined 42.77% year over year and 15.15% month over month, while the average price fell 2.38% year over year to $5.04. The concentration in Edible alongside a double-digit month-over-month decline and a rank at 30 implies that the brand’s one-category exposure is amplifying downside from category-level softness and compressing visibility within the state’s mid-tier.
The combination of a 42.77% year-over-year sales contraction and a 15.15% month-over-month pullback, paired with a 2.38% year-over-year price decrease, indicates that Mountain High Suckers is leaning on price to defend share in Edible but not offsetting volume pressure, which risks further rank erosion from 30 in Colorado. With 100.0% of mix in Edible and no balancing categories, the brand’s positioning skews toward price-sensitive baskets; this pattern suggests a need to shift pack architecture or product differentiation within Edible to stabilize unit velocity rather than relying on additional price moves that have not reversed the 24-month sales decline of 18.82%.
Competitive Landscape
Mountain High Suckers sits at rank 30 in May 2026, improving 4 positions from rank 34 year over year, while holding flat versus February 2026 at rank 30 and remaining 3 positions below its peak rank 27 from October 2025; in contrast, Wyld held rank 1 year over year despite a 15.3% sales decline and Dialed In Gummies stayed at rank 3 with a 20.6% sales increase, indicating that top-tier stability coexists with diverging momentum across leaders. Compared with Wana holding rank 2 year over year and Ript locked at rank 4 with a 1.7% sales lift, Mountain High Suckers’ modest rank gain of 4 places year over year alongside a three-month hold at rank 30 suggests incremental share defense rather than a breakout, implying the brand’s trajectory points to maintaining mid-pack presence unless it converts stability since February 2026 into sustained rank accretion.

Notable Products
Sweet Pieces (100mg) posted the steepest movement in May 2026 with a -17.2% month-over-month decline and slid behind two products to rank 3, while Strawberry Sucker (10mg) delivered a +50.8% jump and holds a share of the top rank alongside Pineapple Rosin Sucker (10mg), which was up +16.9%. CBD/THC Cherry Lollipop (3mg CBD, 10mg THC) fell -36.9% and is tied at rank 7, and Lozenges Large (100mg) also contracted -10.2% at rank 7, indicating heavier pressure on higher-dosage and CBD-inclusive formats. With lollipops/suckers occupying at least five of the top ten Edible spots and Strawberry Sucker (10mg) nearing $837 in sales, the mix points to momentum consolidating around 10mg fruit suckers while multi-piece and CBD-hybrid offerings give ground.
Top Selling Cannabis Brands
Data for this report comes from real-time sales reporting by participating cannabis retailers via their point-of-sale systems, which are linked up with Headset’s business intelligence software. Headset’s data is very reliable, as it comes digitally direct from our partner retailers. However, the potential does exist for misreporting in the instance of duplicates, incorrectly classified products, inaccurate entry of products into point-of-sale systems, or even simple human error at the point of purchase. Thus, there is a slight margin of error to consider. Brands listed on this page are ranked in the top twenty within the market and product category by total retail sales volume.

