Jun-2026
Sales
Trend
6-Month
Product Count
SKUs
Avg Price
YoY Sales Change
YoY Price Change
Market Insights Snapshot
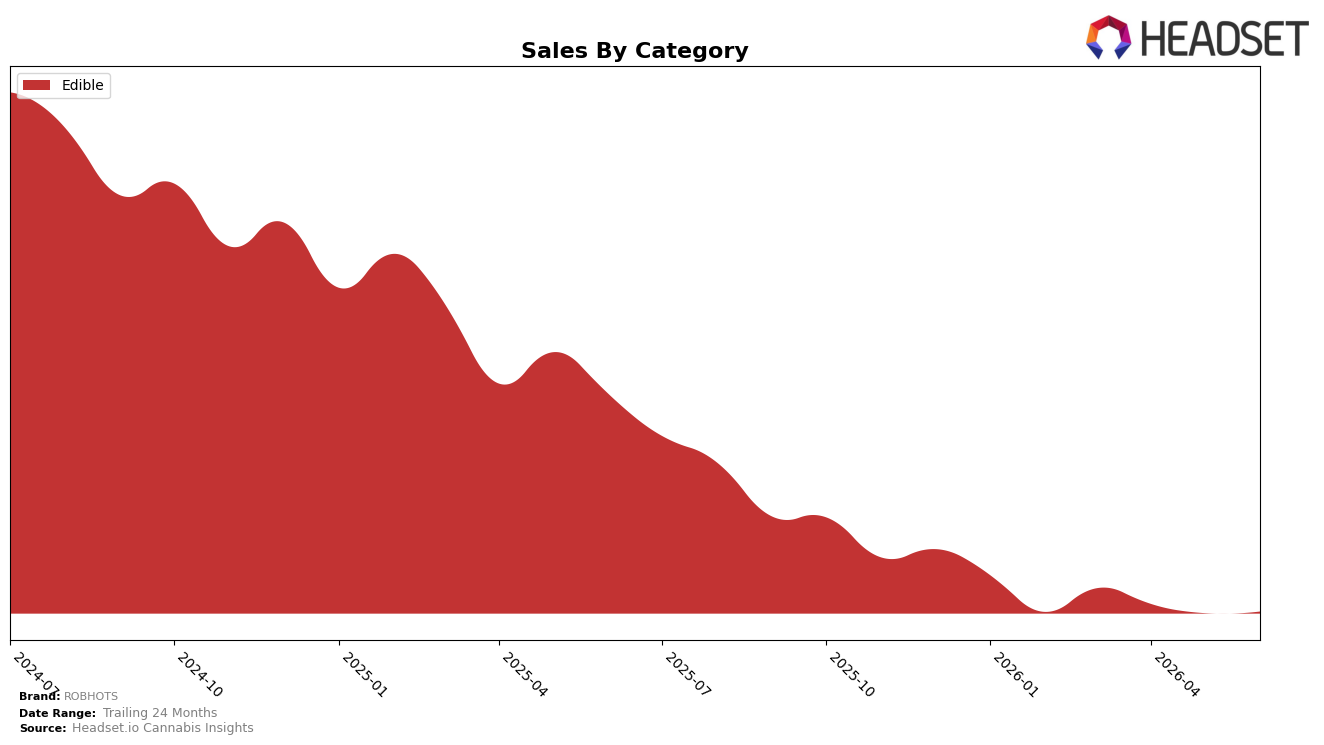
Edible accounted for 100.0% of ROBHOTS in June 2026, with category sales down 48.84% year over year and up 0.72% month over month; average price rose 7.22% YoY while the mix did not diversify beyond Edible. With total brand sales down 48.84% YoY and the 24‑month trend at -69.70%, the single‑category exposure creates concentration risk despite the small MoM uptick of 0.72%, implying that short‑term stabilization is narrowly tied to Edible pricing and velocity rather than broader portfolio balance.
Ranked 28 in Edible in Colorado, ROBHOTS faces a mid‑tier position where price increased 7.22% YoY alongside a 48.84% YoY sales contraction, suggesting elasticity pressure that outpaced any benefit from June 2026’s 0.72% MoM lift. With Edible at 100.0% of mix and the top market identified as MO, the brand’s positioning hinges on defending Edible share through pack architecture or promotional cadence, because current ranks and declines indicate the need to convert MoM bumps into sustained repeat rather than relying on further price-led gains.
Competitive Landscape
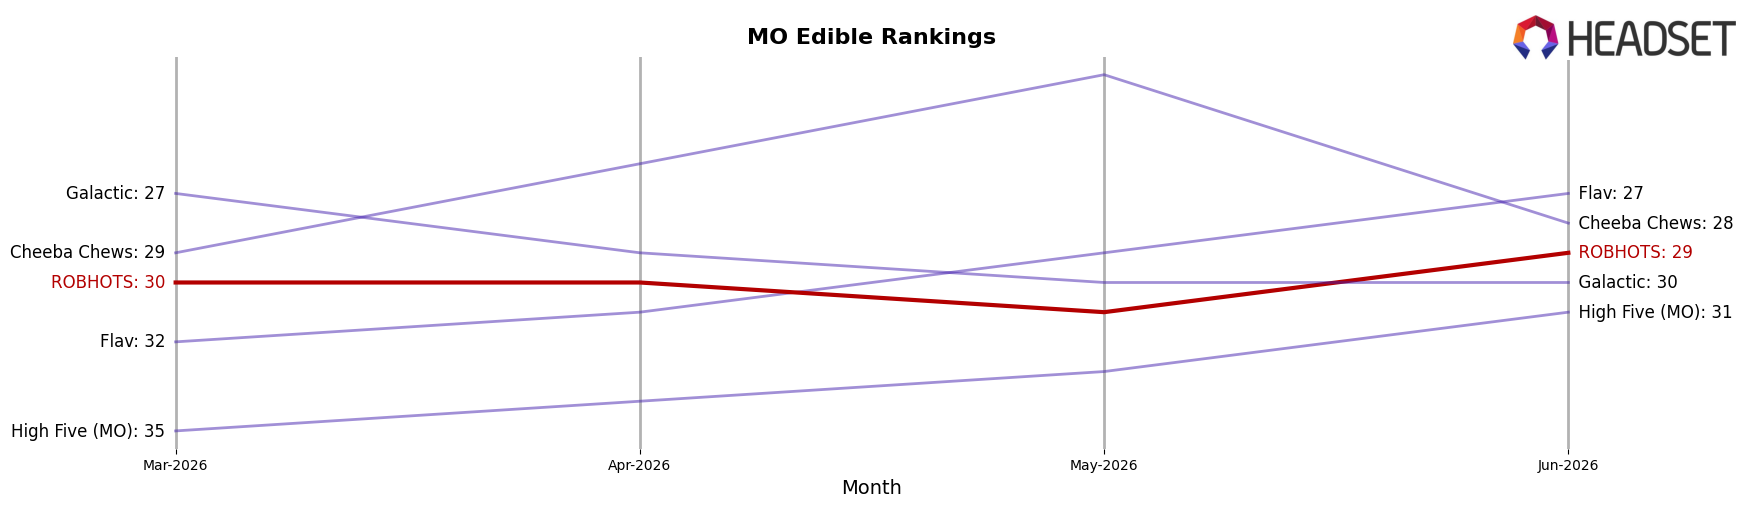
ROBHOTS sits at rank #29 in MO Edible in June 2026, down 5 spots from rank #24 year over year, while improving 1 position from rank #30 in March 2026; the brand’s peak was rank #15 in June 2024, placing the current standing 14 slots below that high-water mark. In contrast, Good Day Farm advanced from rank #4 to #2 with a 19.4% year-over-year sales gain, and Smokiez Edibles slid from rank #2 to #5 alongside a 23.4% sales decline, indicating that upward mobility is available but volatile at the top; against that backdrop, ROBHOTS’ multi-period slippage suggests the brand is getting squeezed in the middle tier and must either trade up-share against weakening leaders or risk further drift from its June 2024 peak. The thesis is that a modest quarter-on-quarter rank lift amid a five-rank year-over-year drop signals stabilization without recovery, implying share defense rather than share capture unless competitive positioning changes.
Notable Products
Pineapple Tangerine Gummies 2-Pack (100mg) posted the steepest decline in June 2026 at -76.6% MoM while sliding to rank 7, contrasting with Strawberry Lemonade Gummies 10-Pack (100mg) which jumped 76.2% MoM to reach rank 8. CBN/THC 2:1 Night Time Gummies 10-Pack (200mg CBN, 100mg THC, 30mg Melatonin) grew 30.7% MoM to hold rank 1 and generated $69,539, as the CBD/THC 1:1 Assorted Fruit Gummies 10-Pack (100mg CBD, 100mg THC) fell -13.3% to rank 10. With all ten top SKUs in Edible Gummies and four of the top five holding or improving positions, the mix points to a portfolio pivot toward functional nighttime and high-CBD formats driving the brand’s near-term focus.
Top Selling Cannabis Brands
Data for this report comes from real-time sales reporting by participating cannabis retailers via their point-of-sale systems, which are linked up with Headset’s business intelligence software. Headset’s data is very reliable, as it comes digitally direct from our partner retailers. However, the potential does exist for misreporting in the instance of duplicates, incorrectly classified products, inaccurate entry of products into point-of-sale systems, or even simple human error at the point of purchase. Thus, there is a slight margin of error to consider. Brands listed on this page are ranked in the top twenty within the market and product category by total retail sales volume.

