.svg)


Where to Buy
Freez-Its is stocked at 53 licensed dispensaries across Colorado, with the deepest coverage in Denver, Colorado Springs, Aurora, Commerce City, and Boulder. Search by ZIP code or city below to find the closest one.
Market Insights Snapshot
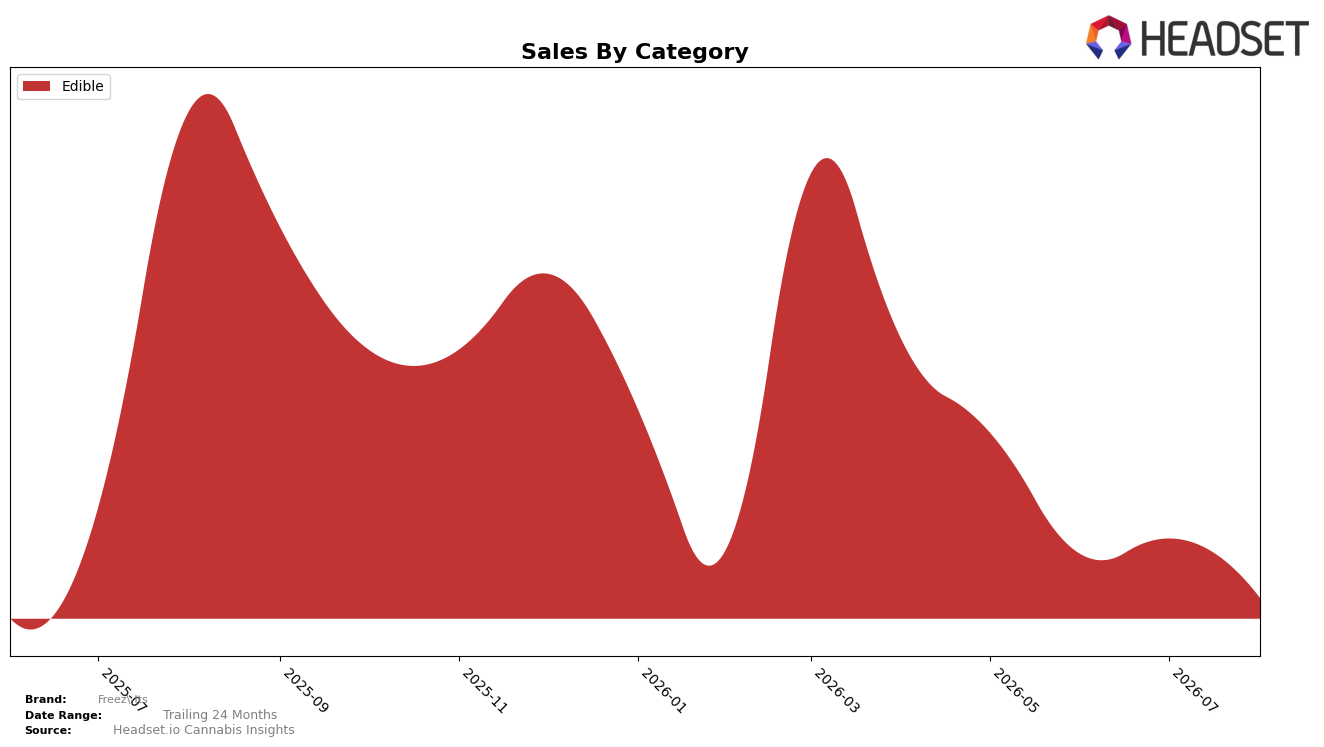
In August 2026, Freez-Its operated as a single-category brand with Edible at 100.0% of sales share, while year-over-year sales in Edible fell 61.2% and month-over-month declined 16.2%. Average price decreased 11.9% YoY to $13.02, pairing with a Colorado Edible rank of 34 to indicate volume contraction outpacing price cuts. The pattern implies concentration risk: a fully Edible-dependent mix combined with double-digit MoM decline and a double-digit price reduction is compressing both rank position and margin headroom.
The August 2026 mix shift — effectively no diversification with Edible at 100.0% and a 61.2% YoY drop against a 16.2% MoM slide — points to a positioning that is overly tied to discount-sensitive buyers rather than premium differentiation, given the 11.9% YoY price decrease. Holding rank 34 in Colorado despite sequential decline suggests the brand is competing lower in the aisle where pricing moves do not translate into share defense. The implication is a need to reframe Freez-Its toward a segmented Edible lineup and targeted price architecture to arrest the MoM slide while rebuilding YoY momentum.
Competitive Landscape
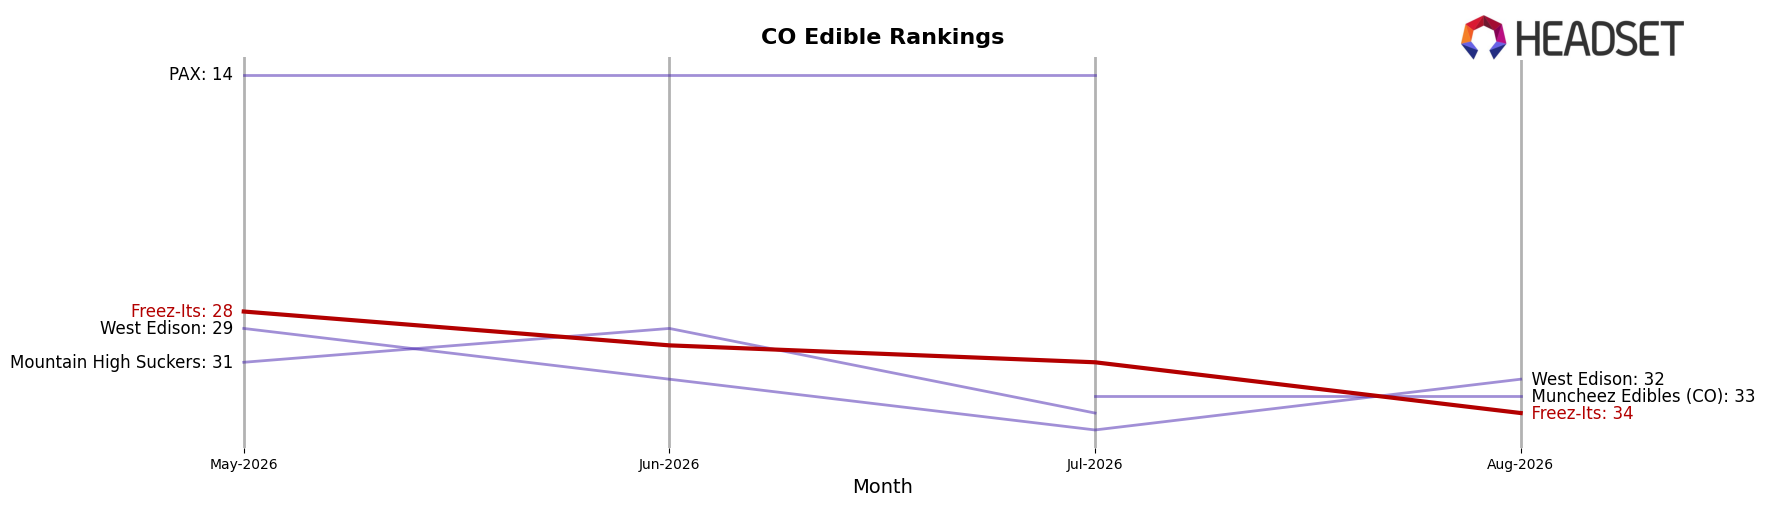
Freez-Its sits at rank #34 in CO Edible for August 2026, slipping 3 positions year over year from #31, and down 6 spots from its 3-month mark at #28, despite having peaked at #23 in March 2026; by contrast, Wyld held #1 both this year and last even as its sales fell 29.0% year over year, while Dialed In Gummies climbed from #3 to #2 on 29.7% sales growth, and Wana slipped from #2 to #3 alongside a 17.3% sales decline. With Joyibles advancing to #5 on 23.2% growth and Ript rising from #5 to #4 despite a 9.3% decline, the pattern points to Freez-Its losing relative velocity against brands that either convert growth into rank gains or maintain leadership amid contraction, implying that its downward rank trajectory will persist without a category-specific trigger to reaccelerate.
Notable Products
Spacecream Sandwich Freeze Dried Treats 10-Pack (100mg) posted the steepest move in August 2026 with a -34% MoM drop and fell to rank 2, while Cosmic Bursts Freeze Dried Treats 10-Pack (100mg) also declined -15% MoM at rank 3. Rainbow Rocks Freeze Dried Treats 10-Pack (100mg) held rank 1 with a -2% MoM dip and $3,864 in sales, and Astro Puffs Freeze Dried Treats 10-Pack (100mg) slid -2% MoM at rank 4. All top four SKUs are Edible products, concentrating the top 10 within a single category and indicating Freez-Its is leaning into a narrow edible-led lineup that is vulnerable to synchronized demand swings.
Top Selling Cannabis Brands






Data for this report comes from real-time sales reporting by participating cannabis retailers via their point-of-sale systems, which are linked up with Headset’s business intelligence software. Headset’s data is very reliable, as it comes digitally direct from our partner retailers. However, the potential does exist for misreporting in the instance of duplicates, incorrectly classified products, inaccurate entry of products into point-of-sale systems, or even simple human error at the point of purchase. Thus, there is a slight margin of error to consider. Brands listed on this page are ranked in the top twenty within the market and product category by total retail sales volume.

