Jun-2026
Sales
Trend
6-Month
Product Count
SKUs
Avg Price
YoY Sales Change
YoY Price Change
Market Insights Snapshot
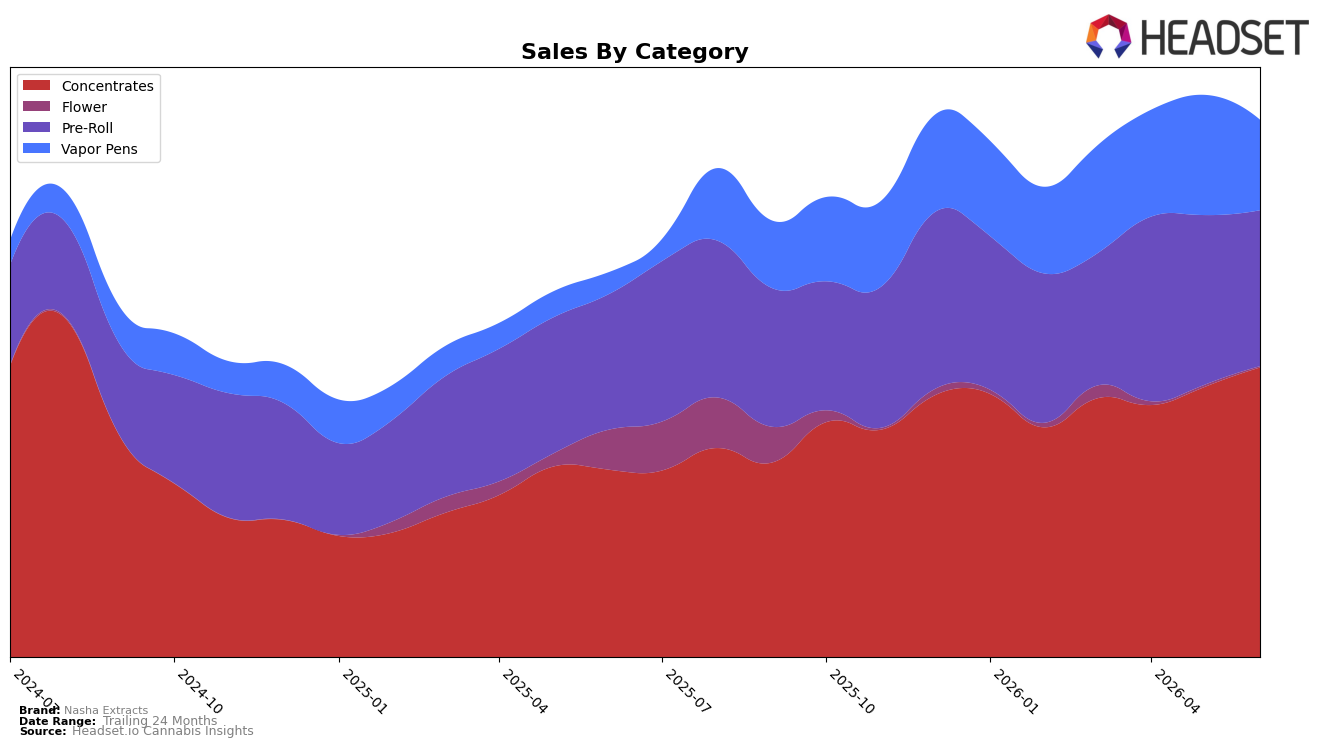
In June 2026, Nasha Extracts concentrated its mix further into Concentrates at 53.95% share with 54.54% YoY growth and 7.21% MoM, while Vapor Pens held 16.84% share on a 314.79% YoY surge but fell 24.71% MoM; Pre-Roll sat at 29.02% share with 15.19% YoY growth and an 8.12% MoM decline, and Flower contracted to 0.19% share with a 97.45% YoY drop and 46.79% MoM slide. The category emphasis pairs with an average price lift of 4.40% YoY to $19.29 and a Concentrates average price of $19.32, implying the brand leaned into its highest-momentum category while tolerating short-term volatility in Vapor Pens to preserve mix stability.
The mix shift implies a deliberate anchoring to the core where Nasha Extracts ranks 13th in Concentrates in California, using 7.21% MoM growth in Concentrates to offset a 24.71% MoM contraction in Vapor Pens and an 8.12% MoM dip in Pre-Roll; this reduces exposure to the 46.79% MoM fall in Flower that now contributes only 0.19% of sales. With Concentrates’ 54.54% YoY growth outpacing Pre-Roll’s 15.19% and aligning with the brand’s 39.81% YoY sales gain, the positioning signals prioritization of category leadership potential in Concentrates over chasing rapid but unstable expansion in Vapor Pens, aiming for rank improvement through depth rather than breadth.
Competitive Landscape
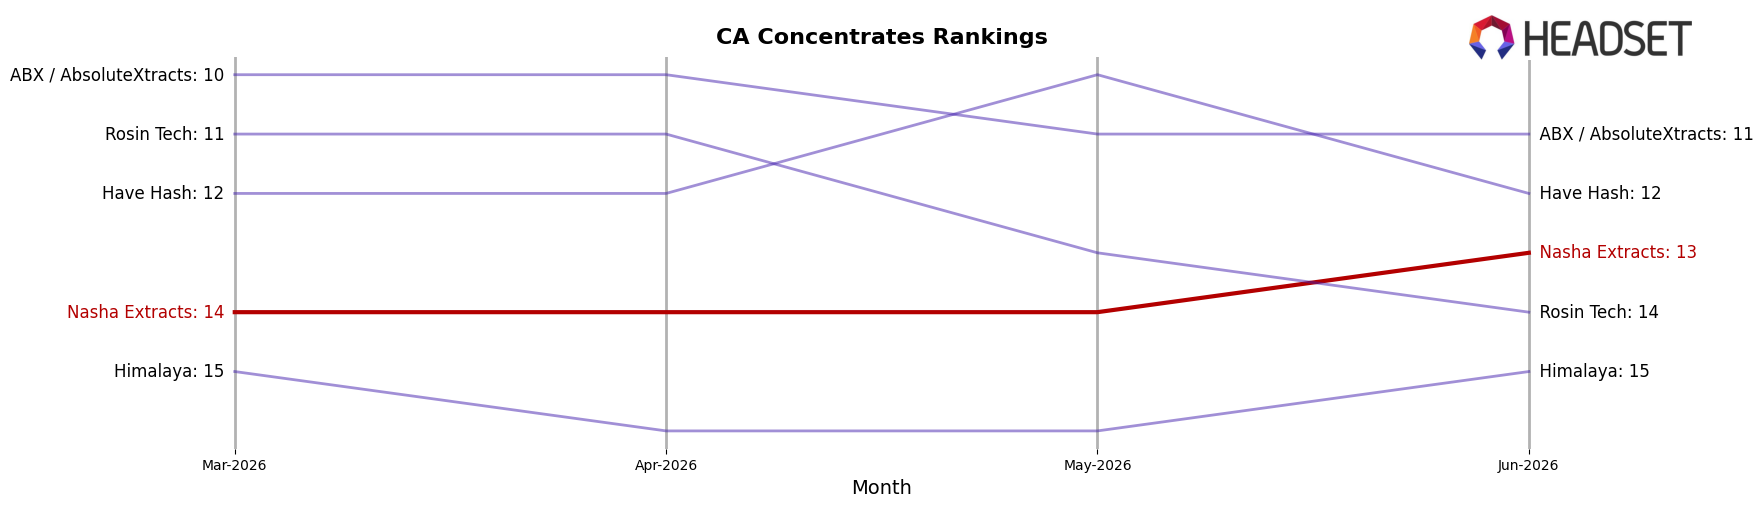
Nasha Extracts sits at rank #13 in CA Concentrates in June 2026, improving 3 positions from rank #16 year over year, while slipping 1 spot from rank #14 three months ago; against a historical peak of #8 in August 2024, the current placement is 5 ranks lower, pointing to partial recovery rather than a full return to peak. Competitive pressure is visible as Raw Garden holds #1 with a 7.0% year-over-year sales increase and 710 Labs moves up to #3 from #4 alongside a 24.7% year-over-year gain, whereas Punch Extracts / Punch Edibles fell to #4 from #3 with a 29.1% year-over-year decline; this mix indicates Nasha Extracts’ modest rank climb is occurring amid diverging peer trajectories and implies a stabilization phase rather than breakout momentum.
Notable Products
Altitude - Blue Dream x Moroccan Peaches Hash Infused Pre-Roll (1g) posted the steepest move in June 2026 with a -61.8% MoM decline while holding rank 6, and Altitude - Papaya Punch x Moroccan Peaches Infused Pre-Roll (1g) also fell -29.0% at rank 7, signaling demand compression within that flavor lane. In contrast, Topper Bubble Hash (1g) rose +31.9% MoM and secured rank 1 with $46,888, while Altitude Hash Infused Pre-Roll (1g) in rank 5 was essentially flat at +0.6%, indicating stability in the core infused format alongside a hash-led upswing. Four of the top ten are Pre-Roll SKUs and three are Concentrates, with ranks 1 and 9–10 occupied by concentrates and ranks 2–8 dominated by pre-rolls, which implies Nasha Extracts is straddling two demand poles: a leading flagship hash driver and a fragmented pre-roll lineup where selective pruning could lift mix quality.
Top Selling Cannabis Brands
Data for this report comes from real-time sales reporting by participating cannabis retailers via their point-of-sale systems, which are linked up with Headset’s business intelligence software. Headset’s data is very reliable, as it comes digitally direct from our partner retailers. However, the potential does exist for misreporting in the instance of duplicates, incorrectly classified products, inaccurate entry of products into point-of-sale systems, or even simple human error at the point of purchase. Thus, there is a slight margin of error to consider. Brands listed on this page are ranked in the top twenty within the market and product category by total retail sales volume.

