.svg)

Sep-2026
Sales
Trend
6-Month
Product Count
SKUs
Avg Price
YoY Sales Change
YoY Price Change


Market Insights Snapshot
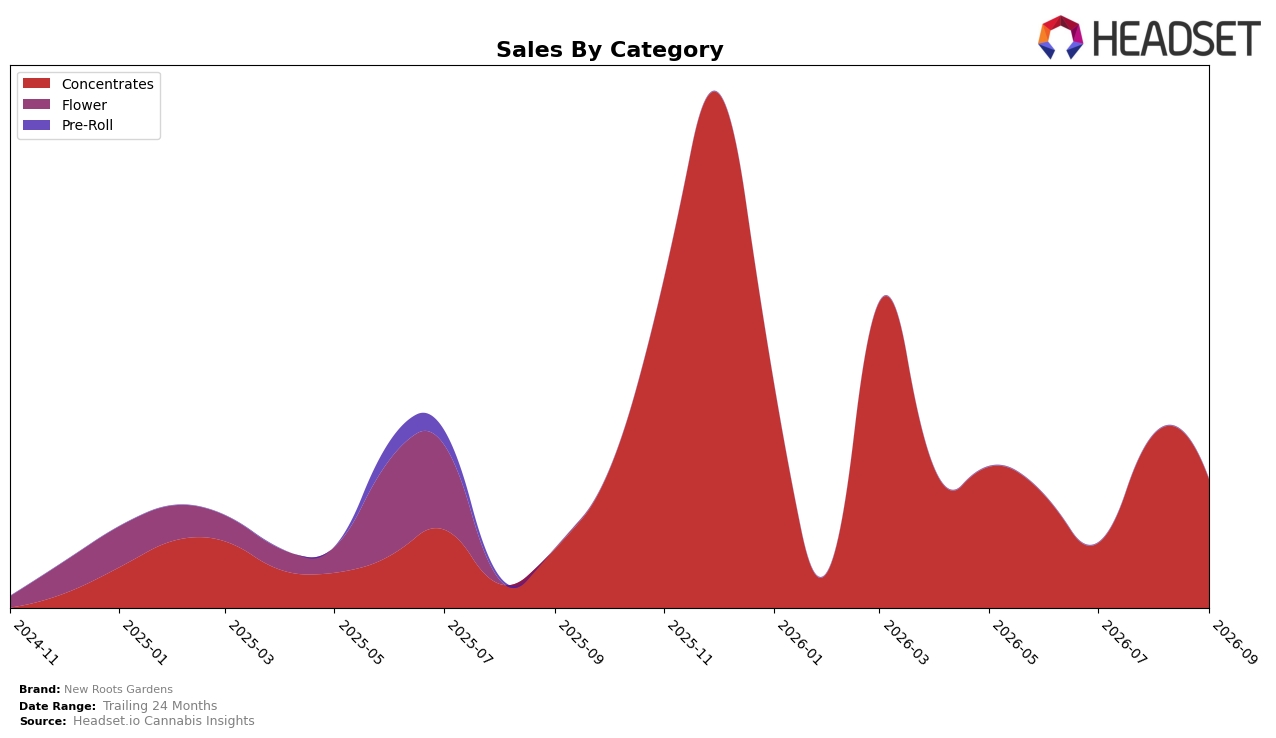
In September 2026, New Roots Gardens operated as a single-category brand in Concentrates with a 100.0% mix share, pairing a rank of 45 in New York Concentrates with a 117.2% year-over-year sales gain and a -26.4% month-over-month contraction. The category’s average price declined -1.0% YoY to $62.11 while the all-in sales base expanded 117.2% YoY, indicating volume-led growth, but the sharp MoM pullback of -26.4% against an unchanged 100.0% mix concentrates execution risk in one lane. The pattern implies New Roots Gardens is amplifying unit throughput in Concentrates but absorbing short-cycle volatility typical of a single-rail assortment, with rank 45 leaving headroom for share capture if stability improves.
The concentration in a single category alongside a -1.0% YoY price decrease and a 117.2% YoY sales rise suggests elasticity-driven gains that could strain if the -26.4% MoM downswing persists, while a rank of 45 signals mid-to-lower tier visibility within New York Concentrates. With 100.0% of sales tied to Concentrates in September 2026 and average price at $62.11, the brand’s positioning leans on value-accessible price points to convert volume, but the month-to-month drawdown points to timing and inventory cadence as key levers; the implication is that diversification or tighter promotional pacing would reduce demand whiplash and improve rank trajectory from 45 without over-reliance on price.
Competitive Landscape
New Roots Gardens sits at rank #45 in NY Concentrates in September 2026, slipping 2 positions year over year from #43 while improving 2 spots versus June 2026’s #47, and its historical ceiling remains the #25 peak from December 2025, which is 20 places higher than today. Against peers, Mfny (Marijuana Farms New York) held #1 both this year and last while expanding sales by 43.6%, and RYTHM climbed from #4 to #2 with 44.2% YoY growth, indicating that leaders consolidated share as New Roots Gardens lost 2 ranks YoY but only gained 2 ranks over three months; this trajectory implies the brand is drifting toward the mid-to-lower tier unless it can convert short-term stabilization into multi-rank gains.

Notable Products
Bickett OG Cold Cure Live Rosin (1g) posted the most notable move in September 2026 with a +71.3% month-over-month jump and a rise to rank 2, while Maple Gas Cold Cure Live Rosin (1g) fell -37.9% and still held rank 1 with $7,431 in sales. Lylah's Rose Live Rosin (1g) declined -9.3% at rank 3, placing two declining SKUs around a single high-growth riser, and all top-3 items sit within Concentrates, indicating a narrow category concentration among the leaders. The pattern suggests New Roots Gardens is leaning into a Concentrates portfolio where volatility at the top is being offset by a fast-climbing secondary SKU, pointing to a shift toward fewer hero products carrying more of the commercial load.
Top Selling Cannabis Brands






Data for this report comes from real-time sales reporting by participating cannabis retailers via their point-of-sale systems, which are linked up with Headset’s business intelligence software. Headset’s data is very reliable, as it comes digitally direct from our partner retailers. However, the potential does exist for misreporting in the instance of duplicates, incorrectly classified products, inaccurate entry of products into point-of-sale systems, or even simple human error at the point of purchase. Thus, there is a slight margin of error to consider. Brands listed on this page are ranked in the top twenty within the market and product category by total retail sales volume.

