May-2026
Sales
Trend
6-Month
Product Count
SKUs
Avg Price
YoY Sales Change
YoY Price Change
Market Insights Snapshot
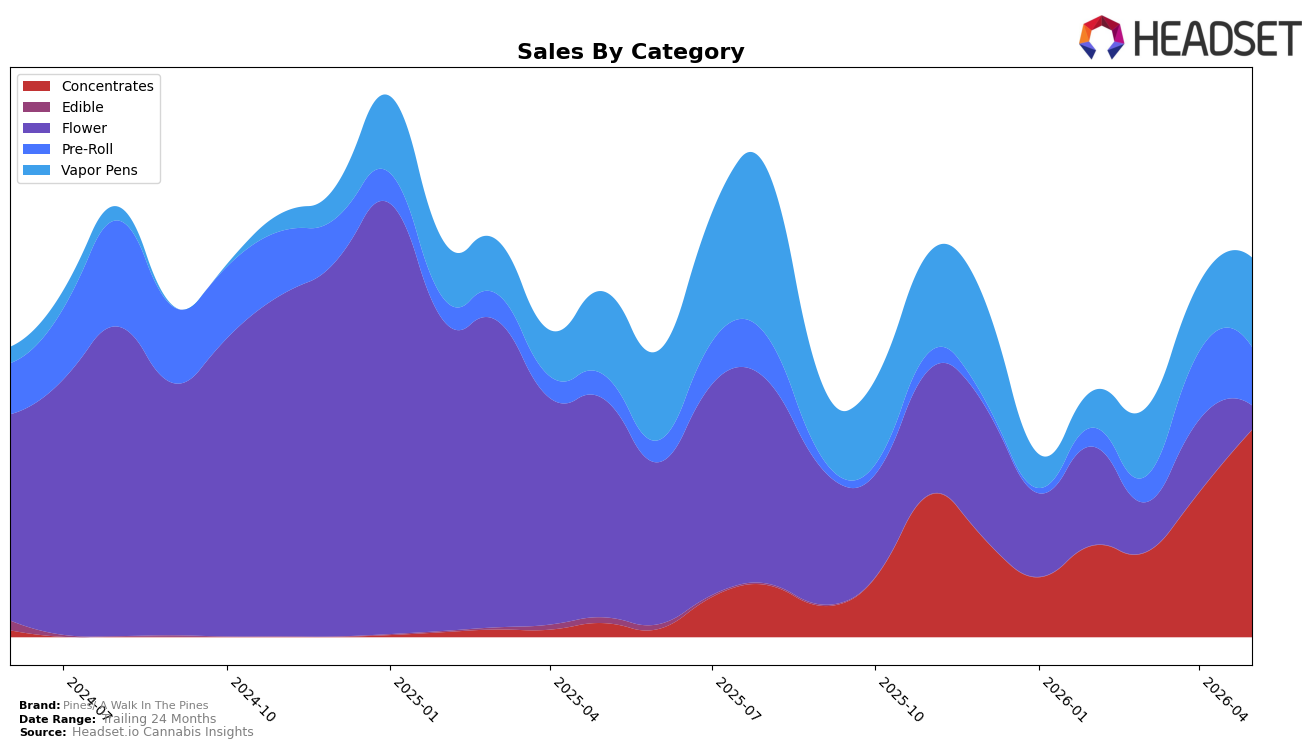
In May 2026, Pines/ A Walk In The Pines tilted heavily into Concentrates at 54.76% share while Vapor Pens held 23.58%, with Pre-Roll at 15.35% and Flower at 6.32%; Concentrates surged 43.87% month over month and 1,401.98% year over year, while Vapor Pens advanced 30.85% MoM and 7.61% YoY. Offsetting that lift, Pre-Roll declined 14.34% MoM despite 143.74% YoY growth, and Flower contracted 66.84% MoM and 89.06% YoY, pulling mix away from lower-price items even as average price fell 3.96% YoY to $24.94; the pattern implies the brand is concentrating volume into higher-potency formats while pruning underperforming Flower.
The mix shift culminated in a rank of 13 in Concentrates within New York, with Concentrates now more than double the share of Vapor Pens (54.76% vs. 23.58%) and over 8.03x Flower (54.76% vs. 6.32%); this aligns with 9.88% brand-level YoY sales growth alongside a 3.96% YoY price reduction. With Pre-Roll’s MoM decline of 14.34% against Concentrates’ 43.87% MoM gain, the brand’s positioning is skewing toward potency-led occasions and away from value-led Flower, implying that future share and rank improvements will hinge on sustaining Concentrates momentum while stabilizing Pre-Roll to avoid overreliance on a single category.
Competitive Landscape
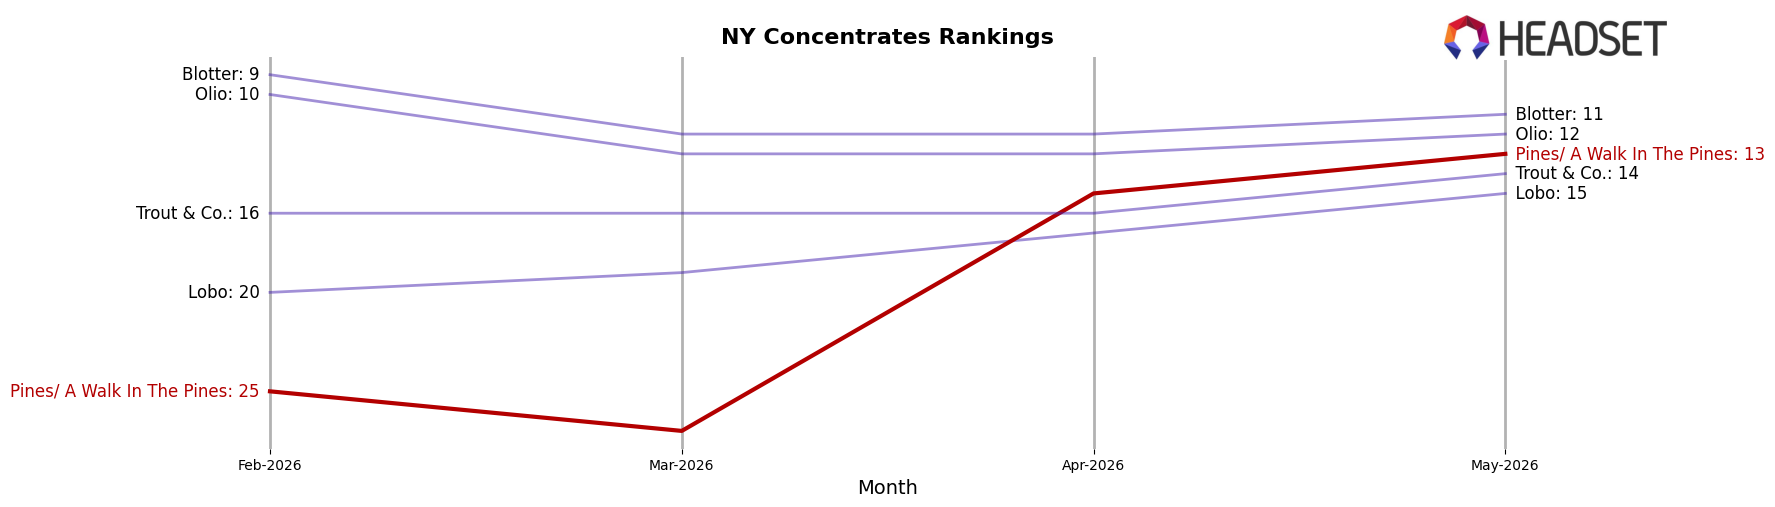
Pines/ A Walk In The Pines sits at rank #13 in NY Concentrates in May 2026, up 24 positions year over year from #37 and climbing 12 spots from #25 in February 2026, while also matching its peak rank of #13 in May 2026; by comparison, Mfny (Marijuana Farms New York) held #1 both year over year and currently with a 55.12% sales increase, and Jetpacks advanced from #4 to #2 alongside 128.78% sales growth. RYTHM moved from #5 to #3 with 90.98% growth, and UMAMII vaulted from #30 to #4 with 3754.77% sales growth, indicating that while Pines/ A Walk In The Pines has accelerated in rank more than 48% relative to its February 2026 position and 64.9% relative to its May 2025 baseline, the competitive set is consolidating at the top, implying the brand’s recent ascent positions it as an emerging mid-tier contender that must convert momentum into sustained top-10 presence.
Notable Products
Funk Dumper Live Resin (1g) posted the largest move in May 2026 with a 102.9% month-over-month surge to rank 3, outpacing Sherb Cakes Infused Pre-Roll 2-Pack (1.4g) at rank 2 with a 68.6% lift and Jelly Pancakes Pre-Roll 2-Pack (1.4g) at rank 1 with a 5.5% gain. Tropicana Cookies Live Resin Disposable (1g) advanced 71.2% to rank 5 while Sour Diesel Live Resin Disposable (1g) rose 24.4% to rank 4, and four of the top ten are Concentrates SKUs clustered between ranks 3 and 9. The concentration of double-digit growth in a mid-pack Vapor Pens duo alongside a triple-digit spike in a Concentrates SKU implies a pivot toward resin-driven form factors that can scale beyond pre-roll leadership.
Top Selling Cannabis Brands
Data for this report comes from real-time sales reporting by participating cannabis retailers via their point-of-sale systems, which are linked up with Headset’s business intelligence software. Headset’s data is very reliable, as it comes digitally direct from our partner retailers. However, the potential does exist for misreporting in the instance of duplicates, incorrectly classified products, inaccurate entry of products into point-of-sale systems, or even simple human error at the point of purchase. Thus, there is a slight margin of error to consider. Brands listed on this page are ranked in the top twenty within the market and product category by total retail sales volume.

