.svg)

Sep-2026
Sales
Trend
6-Month
Product Count
SKUs
Avg Price
YoY Sales Change
YoY Price Change


Where to Buy
Niche is stocked at 64 licensed dispensaries across New Jersey, with the deepest coverage in Hoboken, Bridgeton, Saddle Brook, Somerset, and Voorhees Township. Search by ZIP code or city below to find the closest one, or filter by product type if you are after a specific format.
Market Insights Snapshot
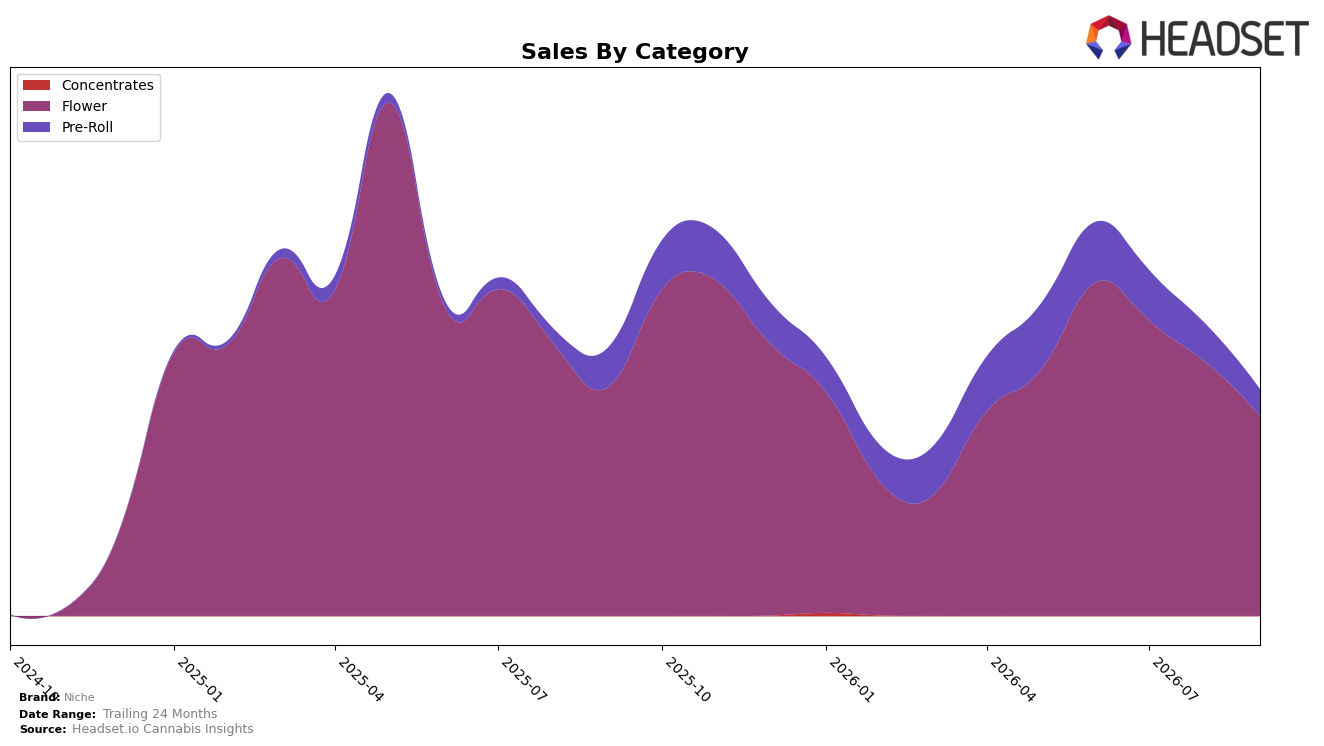
Niche concentrated 88.28% of September 2026 sales in Flower, down 21.44% month over month and 12.70% year over year, while Pre-Roll accounted for 11.72% with a 30.59% MoM decline and a 32.53% YoY drop. Average price fell 11.04% YoY to $28.79, with Flower averaging 35.87 and Pre-Roll at 11.58, indicating price pressure alongside volume contraction. With Flower anchoring the mix and ranking 30th in New Jersey Flower, the simultaneous double-digit MoM and YoY declines across both categories imply that mix concentration amplified downside during September 2026 rather than cushioning it.
Given a 15.61% YoY brand sales decline alongside a 21.44% MoM slide in the 88.28% Flower allocation and a 30.59% MoM drop in the 11.72% Pre-Roll allocation, Niche’s positioning skews toward a single-category exposure that magnifies volatility. The 30th rank in New Jersey Flower combined with an 11.04% YoY price reduction points to a defensive pricing stance that has not offset share pressure, implying that near-term stability would require either diversifying beyond Flower’s 88% share or improving Flower rank efficiency without further price erosion.
Competitive Landscape
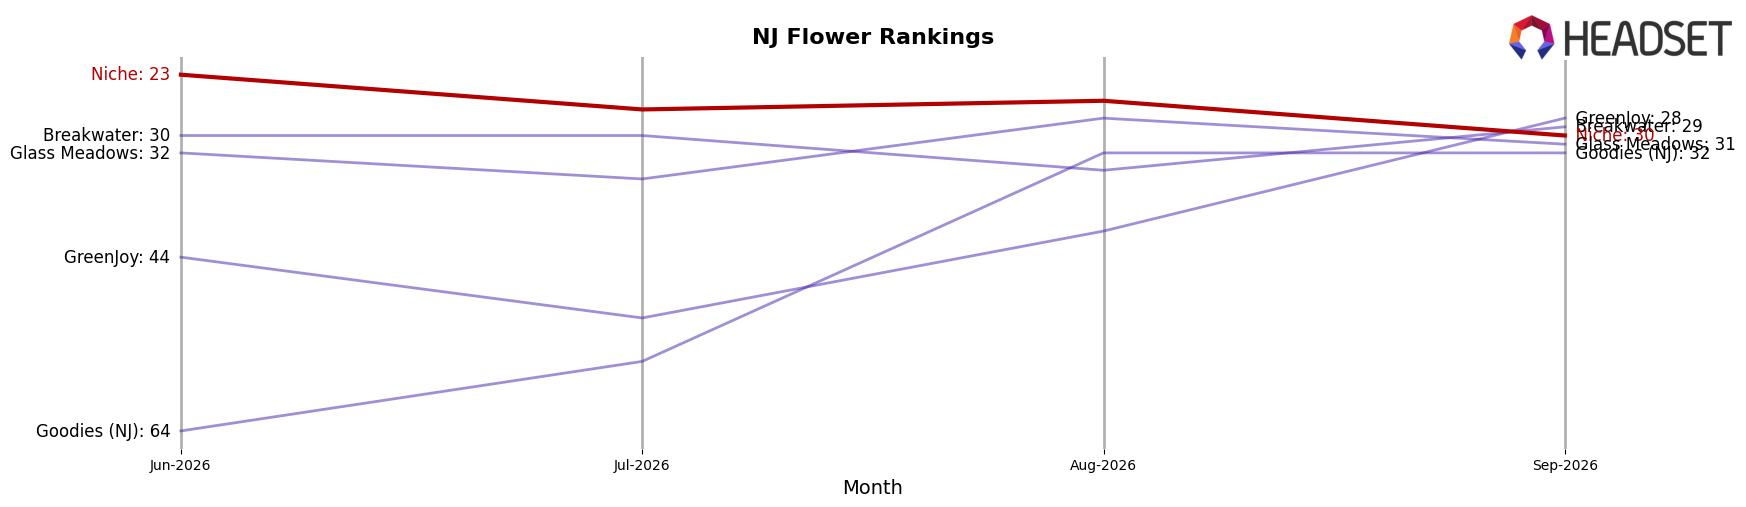
Niche sits at rank #30 in New Jersey Flower for September 2026, down 1 position YoY from #29 and slipping 7 spots since June 2026 when it held #23, indicating a retreat from its peak at #16 in May 2025. In contrast, Find. climbed from #6 to #1 YoY while expanding sales by 111.6%, and Good Green jumped from #17 to #3 with 166.7% YoY sales growth, whereas RYTHM moved from #3 to #4 alongside a 9.8% sales decline; this divergence, combined with Niche’s 1-rank YoY drop and 7-rank three-month slide, implies share is consolidating among faster-rising leaders and Niche must either re-accelerate or cede further rank.
Notable Products
Super Runtz (3.5g) posted the largest month-over-month gain at +59.0% and moved to rank 1, while Blue Nerdz (3.5g) fell -27.5% to rank 2. Pre-Roll volatility was acute, with Bluephoria Pre-Roll 2-Pack (1g) dropping -56.9% at rank 8 and Lemmon #7 Pre-Roll (1g) down -45.1% at rank 6. Four of the top ten are Flower SKUs clustered in ranks 1-4 and 9, and the top SKU generated $41,124, indicating mix consolidation at the top around premium Flower while Pre-Rolls cycle down.
Top Selling Cannabis Brands






Data for this report comes from real-time sales reporting by participating cannabis retailers via their point-of-sale systems, which are linked up with Headset’s business intelligence software. Headset’s data is very reliable, as it comes digitally direct from our partner retailers. However, the potential does exist for misreporting in the instance of duplicates, incorrectly classified products, inaccurate entry of products into point-of-sale systems, or even simple human error at the point of purchase. Thus, there is a slight margin of error to consider. Brands listed on this page are ranked in the top twenty within the market and product category by total retail sales volume.

