Jun-2026
Sales
Trend
6-Month
Product Count
SKUs
Avg Price
YoY Sales Change
YoY Price Change
Market Insights Snapshot
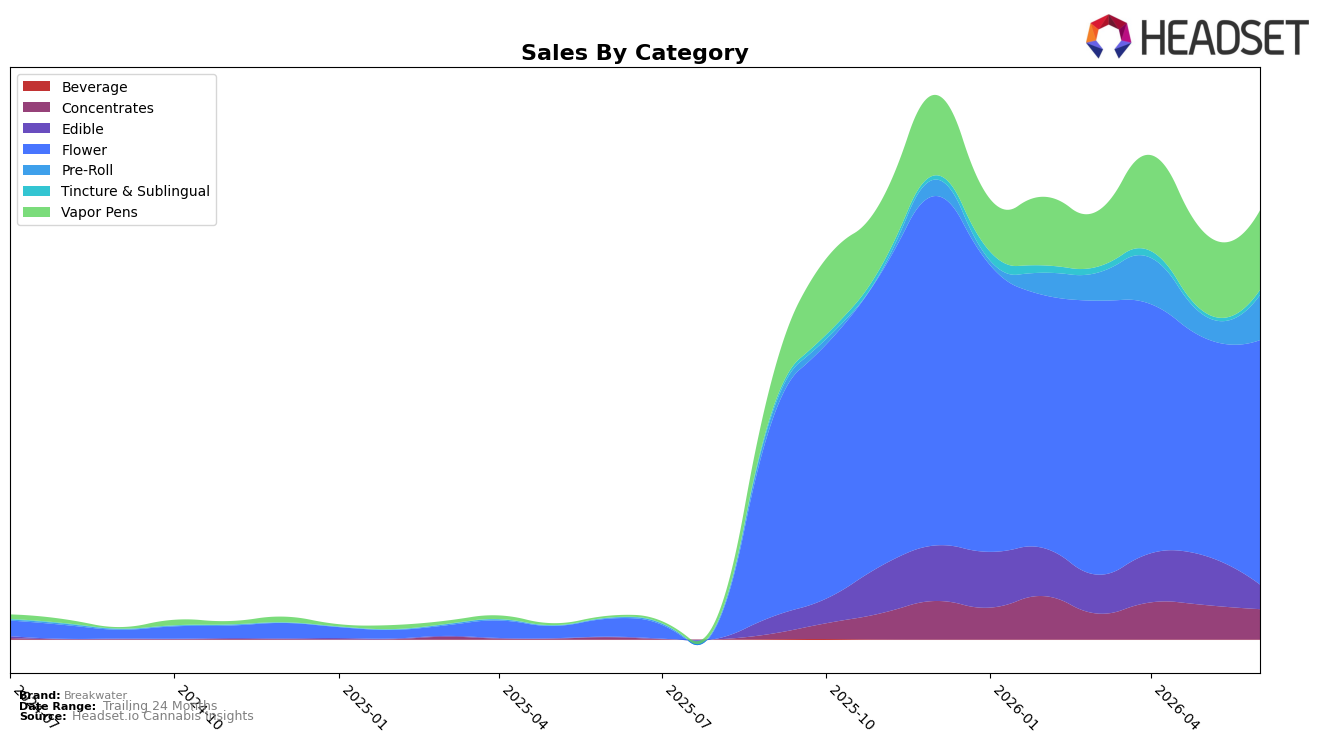
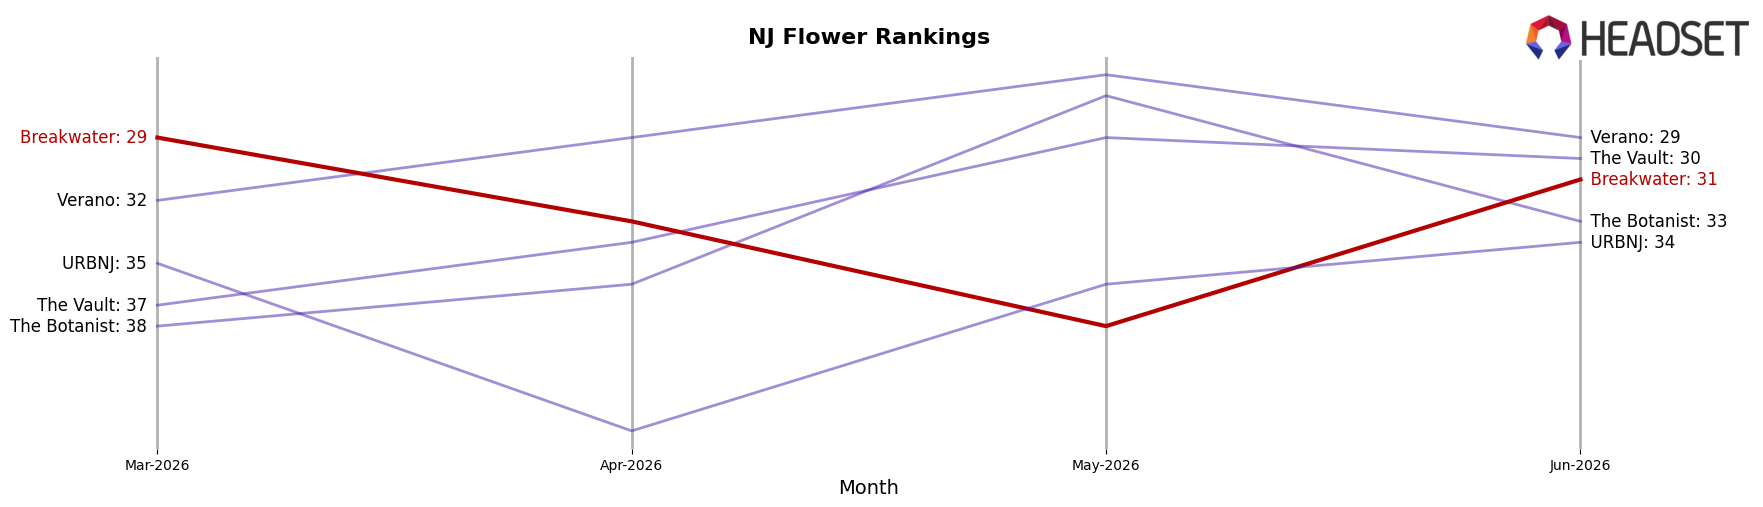
Breakwater’s June 2026 mix concentrates in Flower at 57.13% share with 12.33% MoM growth and 1,283.58% YoY, while Vapor Pens hold 18.52% share with flat 0.23% MoM but 5,203.62% YoY. Pre-Roll accelerated to 10.46% share on 104.05% MoM and 11,249.31% YoY, whereas Concentrates slipped to 7.06% share with -12.16% MoM despite 1,308.15% YoY. Edible sits at 5.68% share after a -50.45% MoM retrenchment even as YoY reached 16,354.45%, and Tincture & Sublingual is 1.15% share with 53.69% MoM. With average price down 21.49% YoY to $45.44 and Flower ranked 31st in New Jersey Flower, the pattern implies volume-led expansion concentrated in inhalables while value tiers and multipack Pre-Roll are absorbing price elasticity faster than non-inhalables.
The mix shift implies Breakwater is anchoring on inhalable trial and basket fill: Flower’s 57.13% share plus Vapor Pens’ 18.52% and Pre-Roll’s 10.46% mean 86.11% of sales sit in forms with rapid trial velocity, aided by -21.49% YoY pricing and 104.05% MoM Pre-Roll momentum. The -12.16% MoM in Concentrates alongside -50.45% MoM in Edible indicates potency-seeking and edible occasion are not scaling with the same cadence as convenience-led formats, suggesting assortment should prioritize Pre-Roll line extensions over Edible resets. With 12.33% MoM in Flower but only 0.23% MoM in Vapor Pens, the thesis is that cartridge velocity is plateauing against Flower gains, so maintaining Flower shelf breadth can improve rank from 31 in New Jersey while targeted promo can re-ignite Vapor Pens without cannibalizing Pre-Roll’s June surge.
Competitive Landscape
Breakwater sits at rank #31 in New Jersey Flower for June 2026, improving 38 positions from #69 year over year, yet slipping 2 spots from #29 in March 2026 while remaining below its #28 peak from December 2025; in contrast, Find. climbed from #12 to #1 with 225.99% YoY sales growth and Ozone held near the top moving from #2 to #2 despite a −10.61% YoY sales change. This mix—Breakwater’s large YoY rank gain alongside a recent quarter-on-quarter dip—implies the brand is recovering share but lacks sustained momentum to re-enter the top 25 unless near-term execution converts the YoY rebound into consistent month-to-month rank improvements.
Notable Products
Deadhead OG x Tom Hill Haze Pre-Roll 2-Pack (1g) posted the steepest shift in June 2026 with a -26.4% month-over-month decline and slipped to rank 10, while Hybrid Full Spectrum RSO (1g) surged +59.2% month-over-month into rank 5, indicating a reallocation of demand toward concentrates over value pre-rolls. Four of the top ten are Pre-Roll SKUs clustered at ranks 1, 2, 3, and 7, yet the only Pre-Roll with a month-over-month signal dropped -26.4% and the top gainer came from Concentrates, implying the category’s breadth masks uneven velocity. (Headband x ChemD) x Skunkdog Bx1 (3.5g) fell -14.7% month-over-month to rank 8 as Purple Ombre Cake (3.5g) held at rank 6 without a visible month-over-month figure, suggesting Flower is ceding incremental share to dose-led formats even as flagship strains maintain placement. Overall, the mix points to Breakwater leaning into higher-THC, outcome-oriented products, with Concentrates absorbing growth while Pre-Rolls supply traffic but face volatility, and a selective Flower strategy preserving rank presence without driving June 2026 gains.
Top Selling Cannabis Brands
Data for this report comes from real-time sales reporting by participating cannabis retailers via their point-of-sale systems, which are linked up with Headset’s business intelligence software. Headset’s data is very reliable, as it comes digitally direct from our partner retailers. However, the potential does exist for misreporting in the instance of duplicates, incorrectly classified products, inaccurate entry of products into point-of-sale systems, or even simple human error at the point of purchase. Thus, there is a slight margin of error to consider. Brands listed on this page are ranked in the top twenty within the market and product category by total retail sales volume.

