Jun-2026
Sales
Trend
6-Month
Product Count
SKUs
Avg Price
YoY Sales Change
YoY Price Change
Market Insights Snapshot
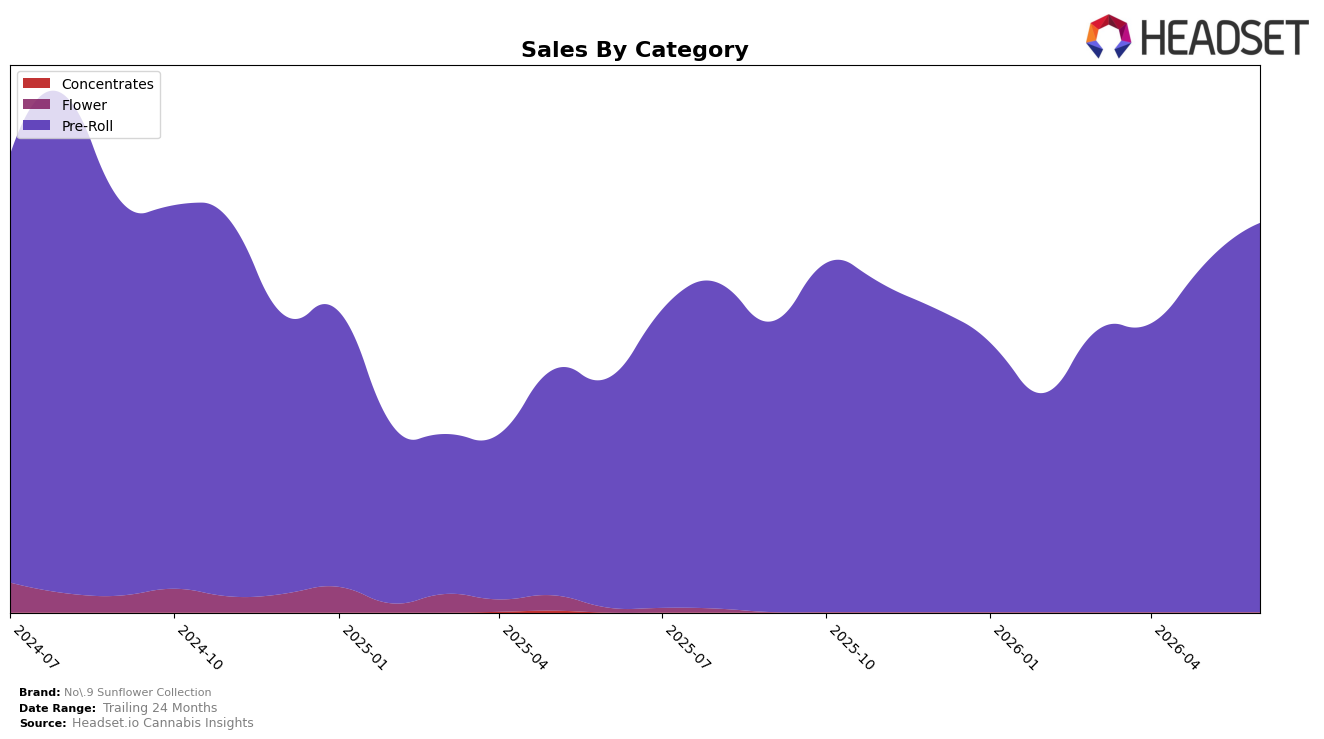
In June 2026, No.9 Sunflower Collection operated as a single-category brand with Pre-Roll at 100.0% of mix, posting year-over-year sales growth of 69.51% alongside month-over-month growth of 11.85%. The brand’s overall year-over-year sales rose 66.25% while average price fell 4.00%, indicating volume gains offsetting a price contraction; within the same month, Pre-Roll average price stood at $29.08. With Pre-Roll ranked 5 in Massachusetts and carrying the entire 100.0% share, the pattern implies that the brand’s momentum is concentrated in one format where rank pressure and price declines are being traded for volume expansion.
The consolidation into 100.0% Pre-Roll, paired with a 69.51% year-over-year gain and an 11.85% month-over-month lift, suggests a positioning bet on scale and repeatability rather than portfolio breadth. The 4.00% decline in average price alongside a rank of 5 in Massachusetts implies a value-to-volume stance aimed at climbing within a tight rank band, while the 66.25% brand-level year-over-year growth and a 24-month sales change of -1.56% indicate that recent gains are recency-weighted rather than multi-year compounding; the net effect is a focus on near-term share capture in Pre-Roll instead of risk-spreading across categories.
Competitive Landscape
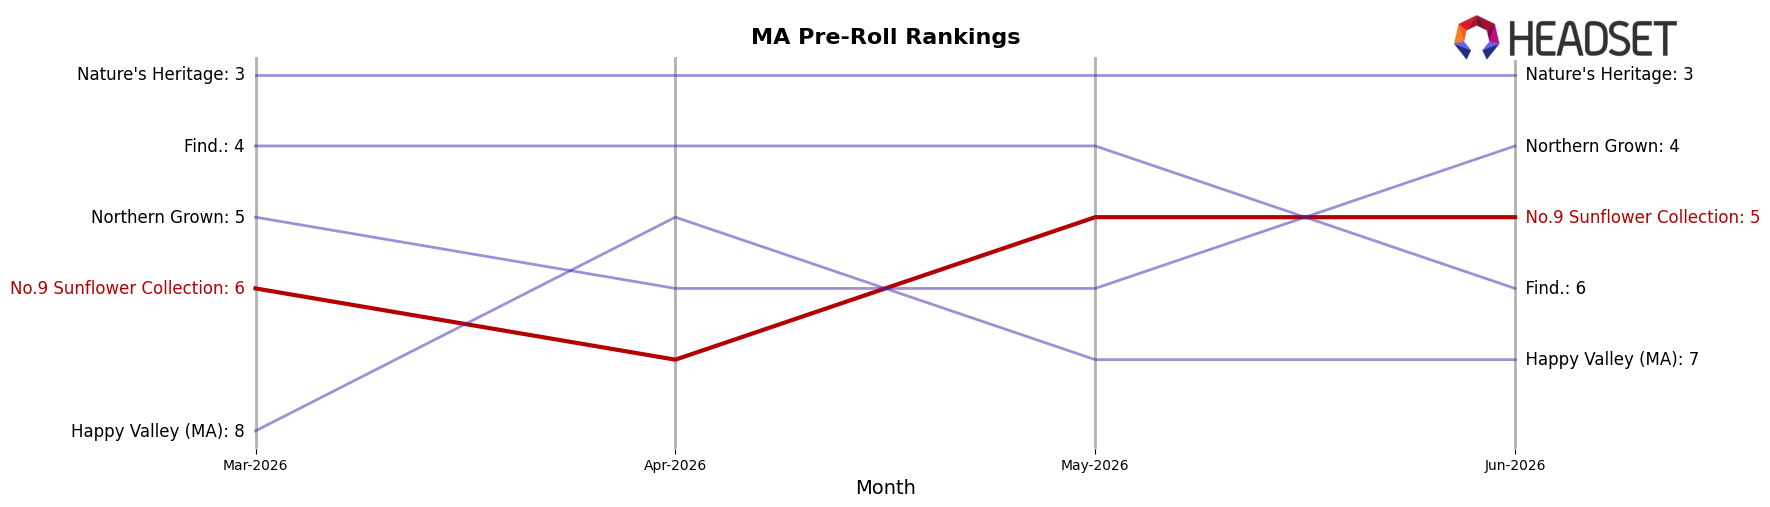
No.9 Sunflower Collection sits at rank #5 in MA Pre-Roll in June 2026 after rising 4 spots from #9 year over year, and edging up 1 position from #6 in March 2026; meanwhile, peak rank was #2 in August 2024, placing the current standing 3 positions below that high-water mark. Jeeter held #1 both year over year and in June 2026, while Cali-Blaze jumped from #32 to #2 and Northern Grown advanced from #18 to #4, indicating that No.9 Sunflower Collection’s modest climb of 1 rank since March 2026 is lagging competitors’ steeper ascents by 2–30 ranks. The pattern implies a stable but narrowing competitive position: incremental gains amid faster-moving rivals signal that maintaining or improving #5 will likely require countering entrants that have converted triple-digit momentum into rank changes of 14–30 places.
Notable Products
Dube Cube - Variety Pre-Roll 5-Pack (3.5g) logged the steepest decline at -15.1% month over month while holding rank 4, contrasting with Doob Cube Micro - Variety Pre-Roll 14-Pack (7g) up 32.5% at rank 1. Doob Cube Mini - Variety Pre-Roll 20-Pack (7g) rose 13.4% at rank 2, and Doob Cube - Original Variety Pre-Roll 14-Pack (14g) added 11.3% at rank 3, indicating that larger-count multipacks are gaining share as the small 5-Pack retreats. The pattern implies a trade-up into higher-count formats, concentrating demand in the top three ranks and away from value-sized singles.
With nine of the top ten SKUs in June 2026 being Pre-Roll formats and four Doob Cube multipacks occupying ranks 1, 2, 3, and 6, category concentration is intensifying toward bundle packs. Lambs Bread Pre-Roll (1g) fell 40.0% at rank 9 while Jelly Donutz Pre-Roll (1g) grew 8.2% at rank 7, further tilting share to multipacks as single 1g sticks fragment. This mix points to a portfolio strategy that leans into multi-count value blocks, suggesting pricing and inventory should prioritize the 14–28 count tiers over standalone grams.
Top Selling Cannabis Brands
Data for this report comes from real-time sales reporting by participating cannabis retailers via their point-of-sale systems, which are linked up with Headset’s business intelligence software. Headset’s data is very reliable, as it comes digitally direct from our partner retailers. However, the potential does exist for misreporting in the instance of duplicates, incorrectly classified products, inaccurate entry of products into point-of-sale systems, or even simple human error at the point of purchase. Thus, there is a slight margin of error to consider. Brands listed on this page are ranked in the top twenty within the market and product category by total retail sales volume.

