Market Insights Snapshot
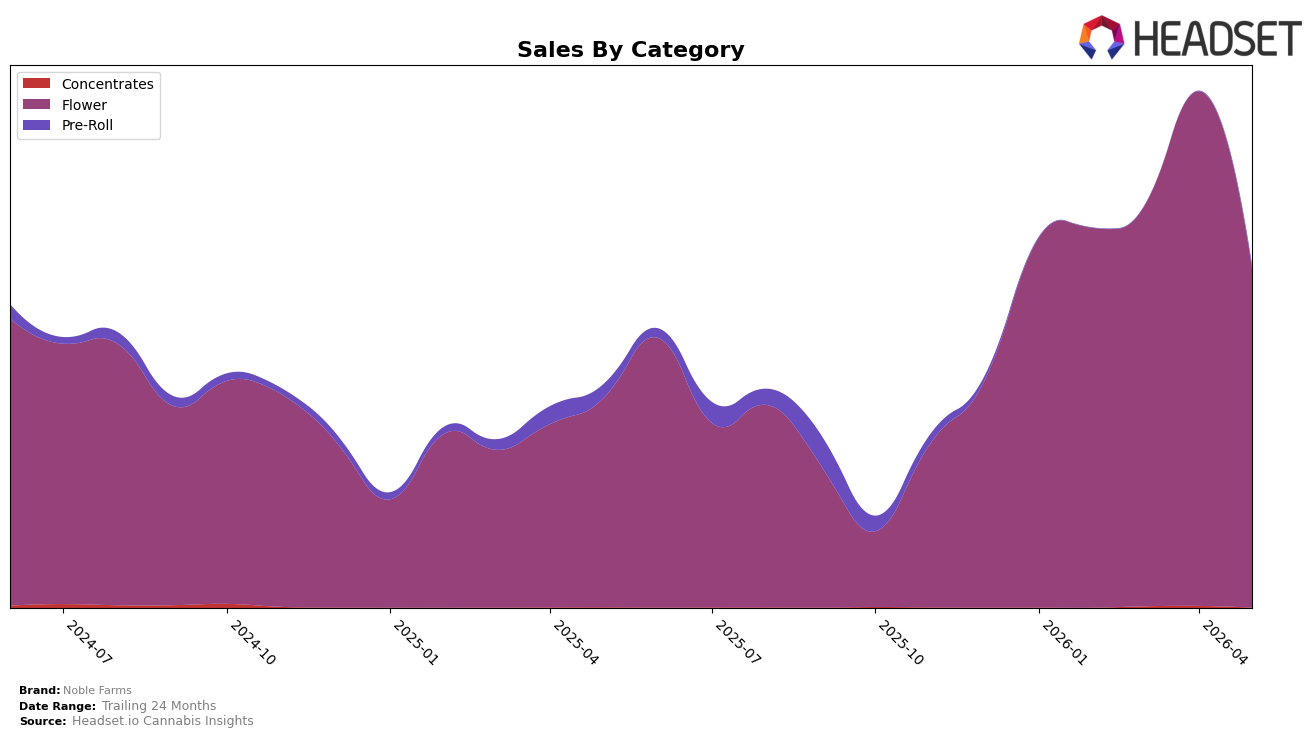
Noble Farms concentrated 99.07% of May 2026 sales in Flower, with Pre-Roll at 0.93% share, while Flower grew 62.45% year over year but declined 34.08% month over month. Pre-Roll contracted 76.79% year over year yet surged 1,295.97% month over month from a low base, and the brand’s average price rose 42.55% YoY to $27.33 as Flower’s average price reached $28.05. In Oregon Flower, the brand ranked 26th, indicating scale primarily tied to a single category and price-led expansion that lifted annual revenue 53.60% despite a sharp monthly pullback; the pattern implies a dependence on Flower volume and pricing that magnifies monthly volatility while anchoring annual growth.
The May 2026 mix shift—Flower down 34.08% MoM alongside a 1,295.97% MoM rebound in Pre-Roll—suggests elasticity around price and stock availability concentrated in Flower, with limited diversification to buffer demand swings. Coupled with a 62.45% YoY Flower increase and a -76.79% YoY in Pre-Roll, plus a 42.55% YoY price lift, the configuration points to a premium-leaning Flower posture that supports rank 26 in Oregon but leaves headroom for stabilization via targeted Pre-Roll recovery; taken together, the shifts imply positioning as a Flower-first operator whose pricing power aids yearly gains yet requires category breadth to reduce month-to-month risk.
Competitive Landscape
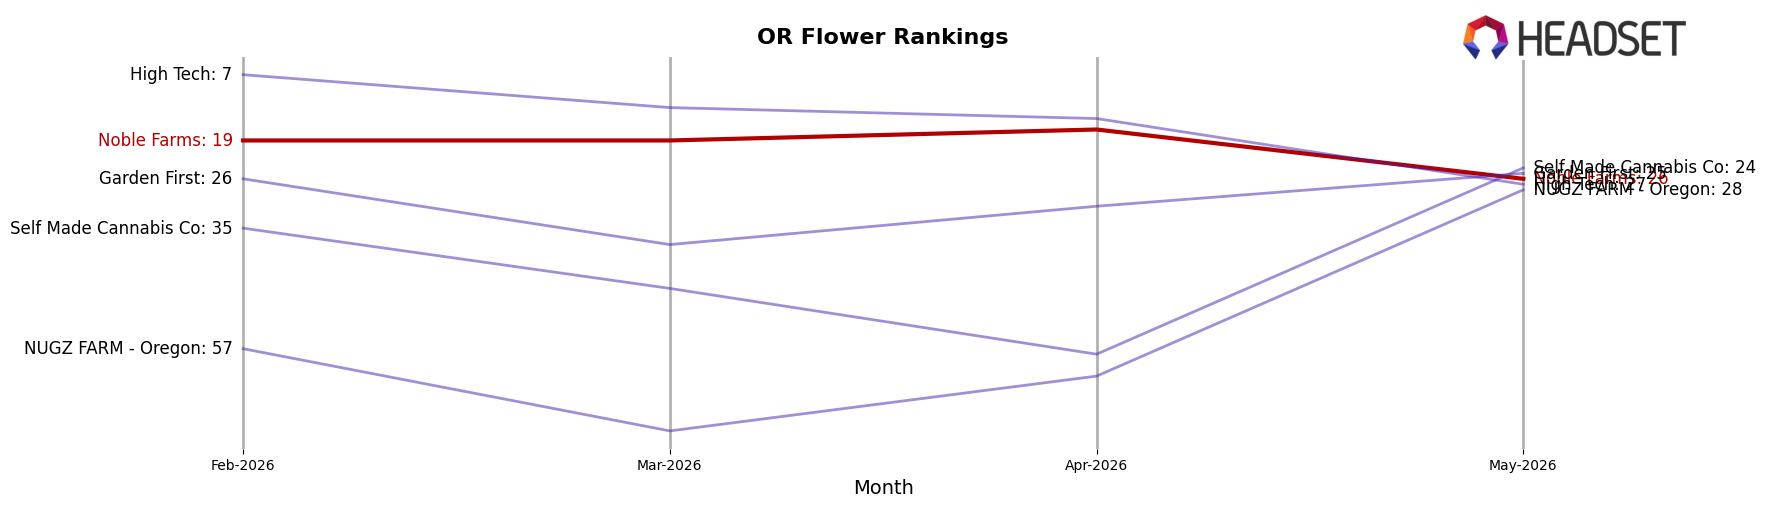
Noble Farms sits at rank #26 in OR Flower in May 2026, improving 20 positions year over year from #46, but sliding 7 spots from #19 three months ago; the brand also dropped 9 positions from its April 2026 peak at #17, indicating recent momentum loss after a short-term high. Competitively, PRUF Cultivar / PRŪF Cultivar held steady at #1 with a 23.9% YoY sales increase while Otis Garden climbed from #20 to #5 on 101.4% YoY growth, outpacing Noble Farms’ rank recovery and compressing mid-tier share; meanwhile, Bald Peak fell from #2 to #3 despite a -12.6% YoY sales change, showing that category leaders can shift without broad market expansion. The pattern implies Noble Farms is transitioning from a recovery phase into a consolidation challenge: annual gains (+20 ranks YoY) coexist with near-term pressure (-7 ranks since February 2026), so sustaining mid-tier placement will require countering faster-climbing rivals now encroaching on the #15–#25 band.
Notable Products
Oregon Royale (1g) delivered the largest month-over-month jump at +61.0% to reach a shared rank of 3, while Silver Snowman (1g) also surged +53.7% to rank 2, indicating that May 2026 momentum skewed toward a narrow set of Flower SKUs despite rank concentration at the very top. In contrast, Orange Slyce (1g) fell -66.3% and dropped behind peers clustered in ranks 3–9, and Wow (1g) declined -25.8% while Sour Snowman (1g) slid -15.9%, signaling simultaneous expansion at the high end and contraction across mid-tier Flower ranks. With eight of the top ten coming from the Flower category and a single raw-dollar standout at $26,223 for Wow (1g), the mix implies Noble Farms is consolidating around a few outperforming Flower SKUs while culling or repricing underperformers to tighten portfolio focus.
Top Selling Cannabis Brands
Data for this report comes from real-time sales reporting by participating cannabis retailers via their point-of-sale systems, which are linked up with Headset’s business intelligence software. Headset’s data is very reliable, as it comes digitally direct from our partner retailers. However, the potential does exist for misreporting in the instance of duplicates, incorrectly classified products, inaccurate entry of products into point-of-sale systems, or even simple human error at the point of purchase. Thus, there is a slight margin of error to consider. Brands listed on this page are ranked in the top twenty within the market and product category by total retail sales volume.

