Market Insights Snapshot
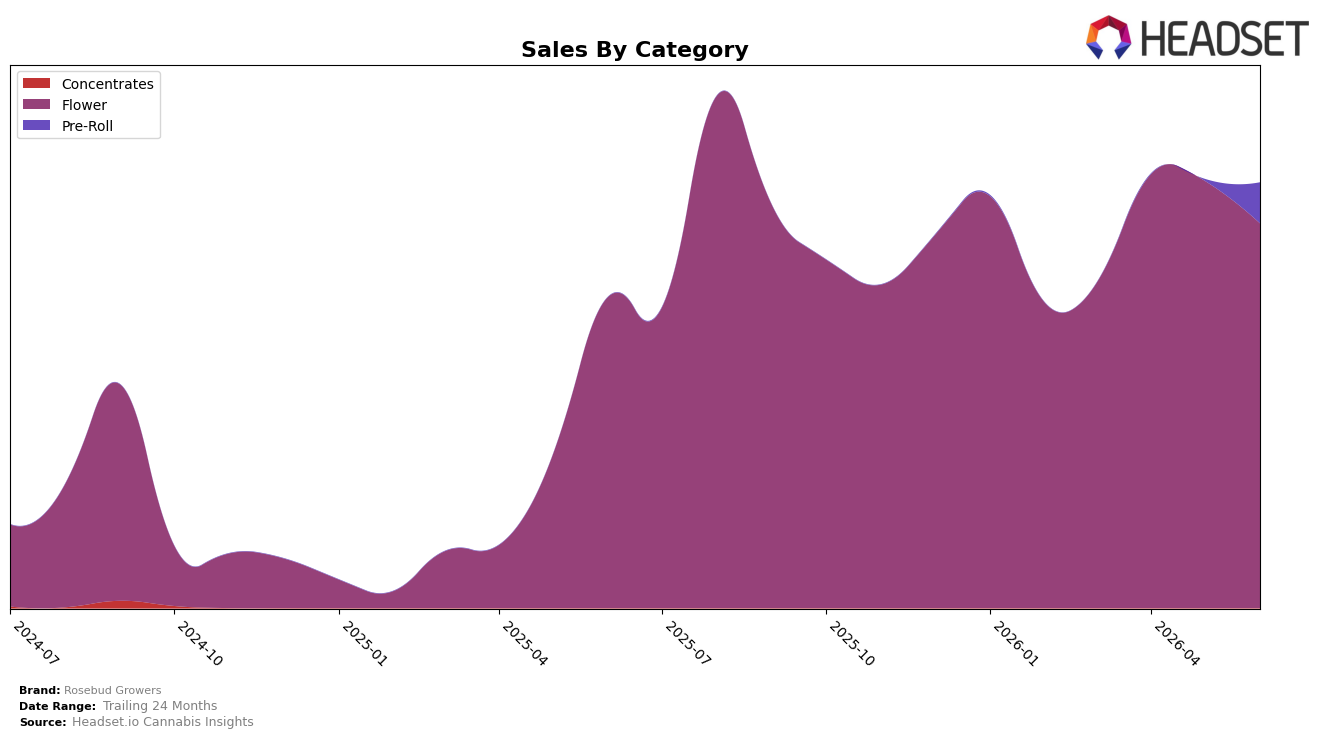
Rosebud Growers concentrated 90.44% of June 2026 sales in Flower, where year-over-year growth was 23.61% but month-over-month declined 9.99%, while Pre-Roll jumped to 9.56% share with a 2,644.57% month-over-month surge off a negligible base and no reported year-over-year figure. Average price rose 11.84% year-over-year to $16.74, with Flower at an average price of $16.45 versus $20.14 in Pre-Roll, and the brand sat at rank 19 in Flower within Oregon. The pattern implies Rosebud Growers is still anchored in Flower but is rapidly testing or scaling Pre-Rolls to offset short-term Flower softness and broaden basket entry points at a modest price premium.
The mix shift toward Pre-Roll from 0% to 9.56% share alongside a 9.99% Flower month-over-month contraction narrows reliance on a single category and introduces a higher-price format that can lift blended revenue per unit as average price is up 11.84% year-over-year. Holding the Flower position at rank 19 in Oregon while Flower grows 23.61% year-over-year but slips month-over-month indicates headroom to regain velocity if Flower stabilizes and the new Pre-Roll contribution sustains; the implication is a pivot toward a two-category cadence that can smooth monthly volatility and open trade-up paths from $16.45 Flower to $20.14 Pre-Rolls.
Competitive Landscape
Rosebud Growers sits at rank #19 in June 2026, improving 6 positions from #25 year over year, and up 9 spots from #28 three months ago; against its historical context, this remains 5 places below its peak of #14 in August 2025. In the same period, PRUF Cultivar / PRŪF Cultivar held steady at #1 with a 0-position YoY change while Grown Rogue climbed from #6 to #2, indicating that market share gains are concentrating near the top even as Rosebud Growers advances within the teens. The pattern implies Rosebud Growers is transitioning from recovery to contention: closing the gap via consistent rank gains but still needing a 5-rank leap to revisit its August 2025 ceiling.

Notable Products
Sour Breth (3.5g) posted the largest move with a 290.2% month-over-month jump to the number 1 rank, outpacing Turbo Diesel (1g) at number 3 with a 112.8% gain and Sour Breath B Buds (Bulk) at number 2 with a 207.4% surge. Candyland (Bulk) fell 17.8% while holding at number 6, indicating volatility alongside the bulk of gains at the top. With nine of the top ten SKUs in Flower and three Sour Breath variants occupying ranks 1, 2, and 6, the mix tilts toward scaling a single terpene lineage within Flower rather than diversifying formats.
Top Selling Cannabis Brands
Data for this report comes from real-time sales reporting by participating cannabis retailers via their point-of-sale systems, which are linked up with Headset’s business intelligence software. Headset’s data is very reliable, as it comes digitally direct from our partner retailers. However, the potential does exist for misreporting in the instance of duplicates, incorrectly classified products, inaccurate entry of products into point-of-sale systems, or even simple human error at the point of purchase. Thus, there is a slight margin of error to consider. Brands listed on this page are ranked in the top twenty within the market and product category by total retail sales volume.

