Market Insights Snapshot
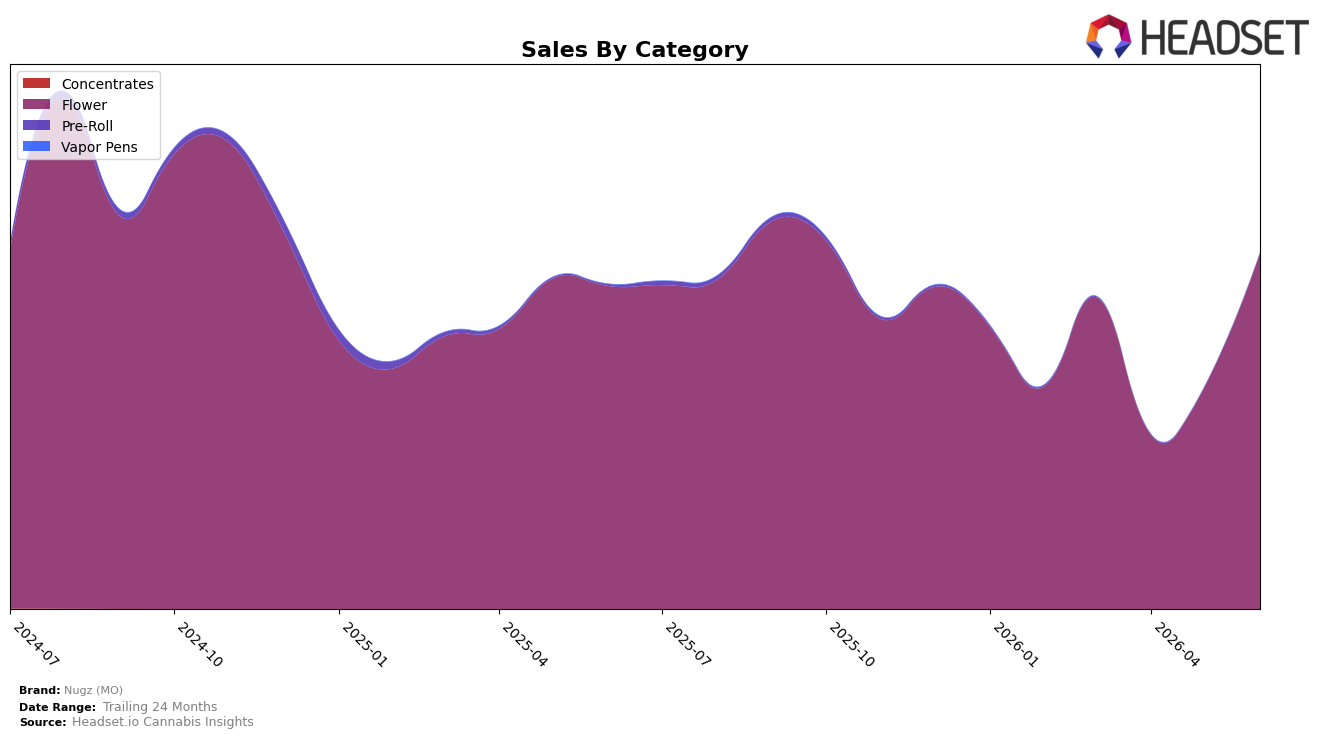
In June 2026, Nugz (MO) concentrated 99.97% share in Flower with a 60.23% month-over-month lift and 10.15% year-over-year growth, while Pre-Roll fell to 0.03% share with a 48.97% month-over-month decline and a 93.58% year-over-year drop. Overall brand sales rose 9.66% year over year as the average price fell 29.28% to $37.02, indicating volume expansion concentrated in Flower rather than diversification. The pattern implies a single-category scale-up in Missouri, with Pre-Roll effectively deprioritized despite June 2026’s large Flower surge and rank position 10 in Flower anchoring visibility.
Nugz (MO)’s rank of 10 in Flower within Missouri combined with a 60.23% month-over-month Flower increase and a 29.28% year-over-year price reduction suggests a push to gain share by trading price for velocity. With category share concentrated at 99.97% in Flower and Pre-Roll contracting 93.58% year over year, the brand’s positioning tilts toward value-led Flower throughput rather than portfolio breadth, implying defensibility in Flower but exposure to mix risk if price elasticity weakens.
Competitive Landscape
Nugz (MO) sits at rank #10 in Missouri Flower for June 2026, improving 3 places year over year from #13, while holding flat versus March 2026 at #10; this stability contrasts with Sinse Cannabis moving up from #5 to #2 alongside a 33.2% YoY sales gain and Flora Farms remaining at #1 despite a 5.1% YoY sales decline. The category’s upper tier also saw Amaze Cannabis advance from #6 to #4 with 43.8% YoY growth and Local Cannabis Co. rise from #10 to #5 with 28.3% YoY growth, while Nugz (MO)’s best historical position remains #9 from November 2024. The pattern implies Nugz (MO) is holding share against a mix of accelerating climbers and a softening leader, but without a fresh catalyst its ceiling near the top 10 is unlikely to change.

Notable Products
Triple Burger Popcorn (7g) posted the largest month-over-month gain at +88.1% while rising into rank 5, and Triple Burger Shake (14g) followed with +81.5% as it reached rank 2. Slurricane (3.5g) fell -15.6% and slid to rank 6, contrasting with Nugz Blueberry Clementine (3.5g) at +52.5% in rank 4. Eight of the top ten are Flower, and two Blue Burger SKUs in the top ten indicate format breadth within one strain family without diluting rank momentum. The pattern implies Nugz (MO) is leaning into larger and value-forward Flower formats to capture upside while pruning underperforming 3.5g entries.
Top Selling Cannabis Brands
Data for this report comes from real-time sales reporting by participating cannabis retailers via their point-of-sale systems, which are linked up with Headset’s business intelligence software. Headset’s data is very reliable, as it comes digitally direct from our partner retailers. However, the potential does exist for misreporting in the instance of duplicates, incorrectly classified products, inaccurate entry of products into point-of-sale systems, or even simple human error at the point of purchase. Thus, there is a slight margin of error to consider. Brands listed on this page are ranked in the top twenty within the market and product category by total retail sales volume.

