Market Insights Snapshot
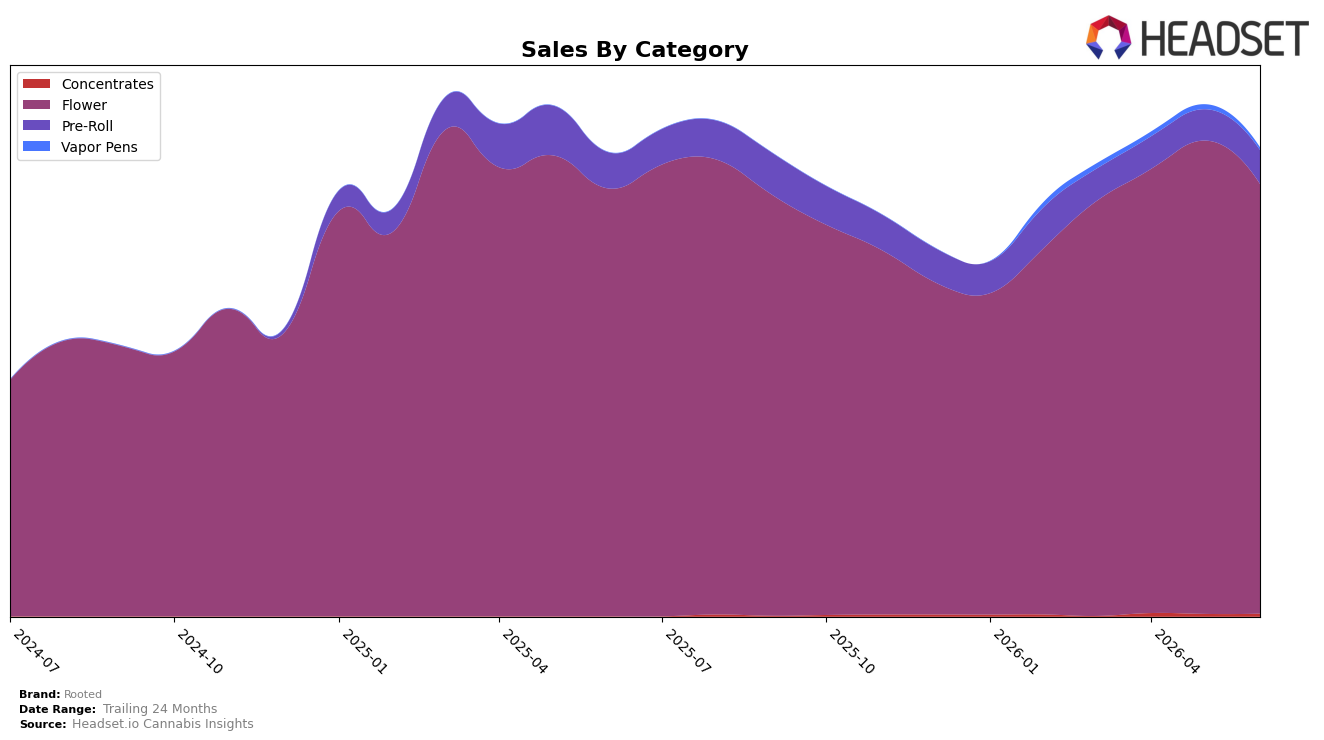
Rooted’s category mix in June 2026 is concentrated in Flower at 91.76% share with month-over-month sales down 9.24% while year-over-year sales are up 40.49%, indicating a volume pullback against a larger annual base; Pre-Roll holds 7.18% share with MoM up 8.75% but YoY down 6.05%, pointing to near-term trial offset by longer-term erosion. Smaller lines moved unevenly, with Concentrates at 0.57% share growing 9.51% MoM and Vapor Pens at 0.49% share falling 49.76% MoM, even as Rooted’s overall average price rose 4.16% YoY and brand sales increased 97.53% YoY. The thesis is that Rooted is over-indexed to a single engine — Flower — whose short-term decline contrasts with Pre-Roll and Concentrates’ MoM upticks, implying concentration risk alongside early diversification.
Positioning-wise, a 91.76% Flower dependency combined with a June 2026 rank of 15 in Flower in Missouri suggests mid-pack visibility that could slide if the 9.24% MoM drop persists while Vapor Pens contract 49.76% MoM. However, the 8.75% MoM gain in Pre-Roll and 9.51% MoM gain in Concentrates, paired with a 97.53% YoY brand sales lift and a 4.16% YoY average price increase, imply pricing power anchored in Flower that can be repurposed to build a secondary foothold. The thesis is that Rooted’s path to insulation from Flower volatility is to convert June 2026 Pre-Roll and Concentrates momentum into sustained share — even a 1–2 point shift from Flower toward these formats would reduce exposure while preserving rank stability.
Competitive Landscape
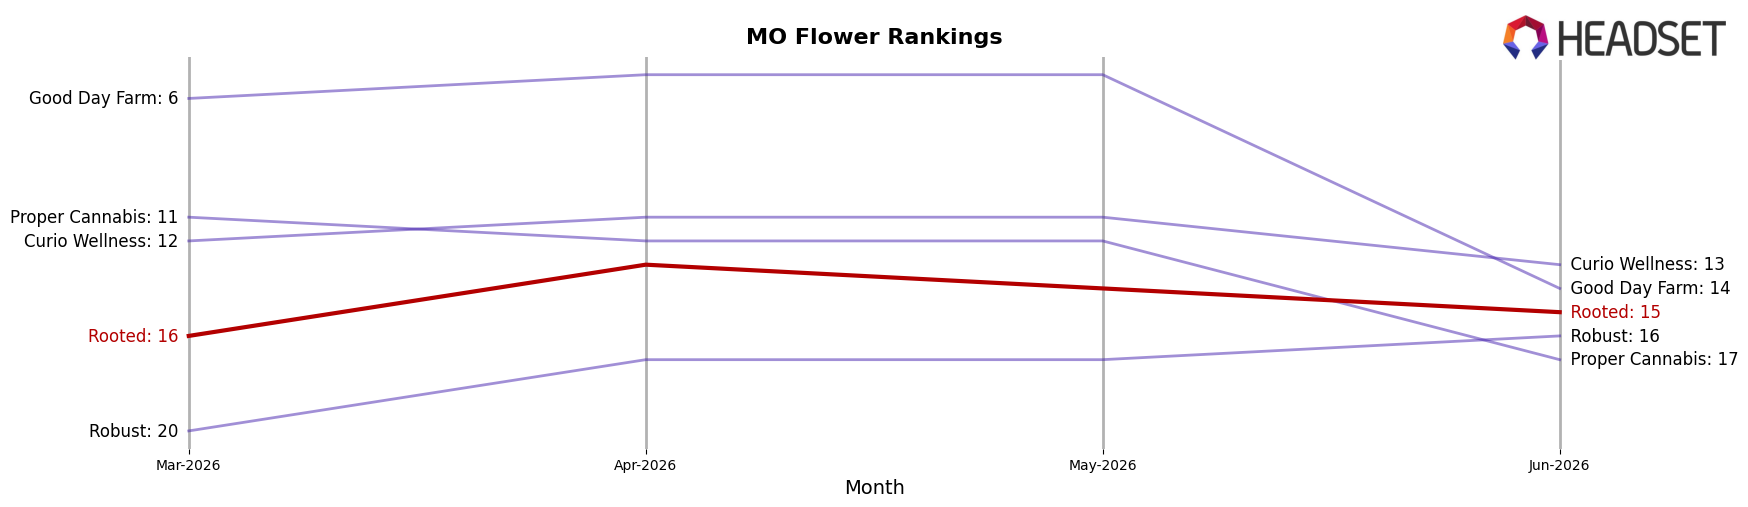
Rooted ranks #15 in Missouri Flower for June 2026, sliding 4 positions year over year from #11 while edging up 1 place versus March 2026 when it sat at #16; by contrast, Sinse Cannabis advanced from #5 to #2 and Amaze Cannabis climbed from #6 to #4 as their sales expanded by 33.2% and 43.8% year over year, respectively. Rooted’s current #15 stands 5 spots below its peak #10 in May 2025 and 14 positions behind Flora Farms at #1, which contracted by 5.1% year over year while holding the top rank; this widening gap alongside competitors’ upward rank mobility implies Rooted’s trajectory is drifting toward a mid-pack position unless share recapture reverses the rank slide.
Notable Products
Ozark Hash (3.5g) is the headline mover in June 2026, climbing to rank 1 with a +51.2% month-over-month surge while Wedding Cake (3.5g) slid to rank 2 on a -20.1% decline, and Dark Starz (3.5g) fell to rank 3 on a steeper -39.0% drop. With eight of the top ten rooted in Flower and only two Pre-Rolls in the mix, the category concentration suggests Rooted is leaning into core eighths even as Dark Star Pre-Roll (1g) contracted -48.1% at rank 7; the one outlier uptrend, a single SKU powering the top spot with $205,848, implies reliance on a hero Flower strain to offset broad pullbacks. The pattern implies Rooted’s commercial direction is consolidating around a flagship Flower SKU while trimming exposure to underperforming Pre-Rolls and reevaluating lagging Flower variants.
Top Selling Cannabis Brands
Data for this report comes from real-time sales reporting by participating cannabis retailers via their point-of-sale systems, which are linked up with Headset’s business intelligence software. Headset’s data is very reliable, as it comes digitally direct from our partner retailers. However, the potential does exist for misreporting in the instance of duplicates, incorrectly classified products, inaccurate entry of products into point-of-sale systems, or even simple human error at the point of purchase. Thus, there is a slight margin of error to consider. Brands listed on this page are ranked in the top twenty within the market and product category by total retail sales volume.

