.svg)

Sep-2026
Sales
Trend
6-Month
Product Count
SKUs
Avg Price
YoY Sales Change
YoY Price Change


Where to Buy
Nuvata is stocked at 103 licensed dispensaries across Illinois, California, and 3 other states, 58 of them in Illinois, with the deepest coverage in Chicago, Addison, DeKalb, East Peoria, and Elgin. Search by ZIP code or city below to find the closest one.
Market Insights Snapshot
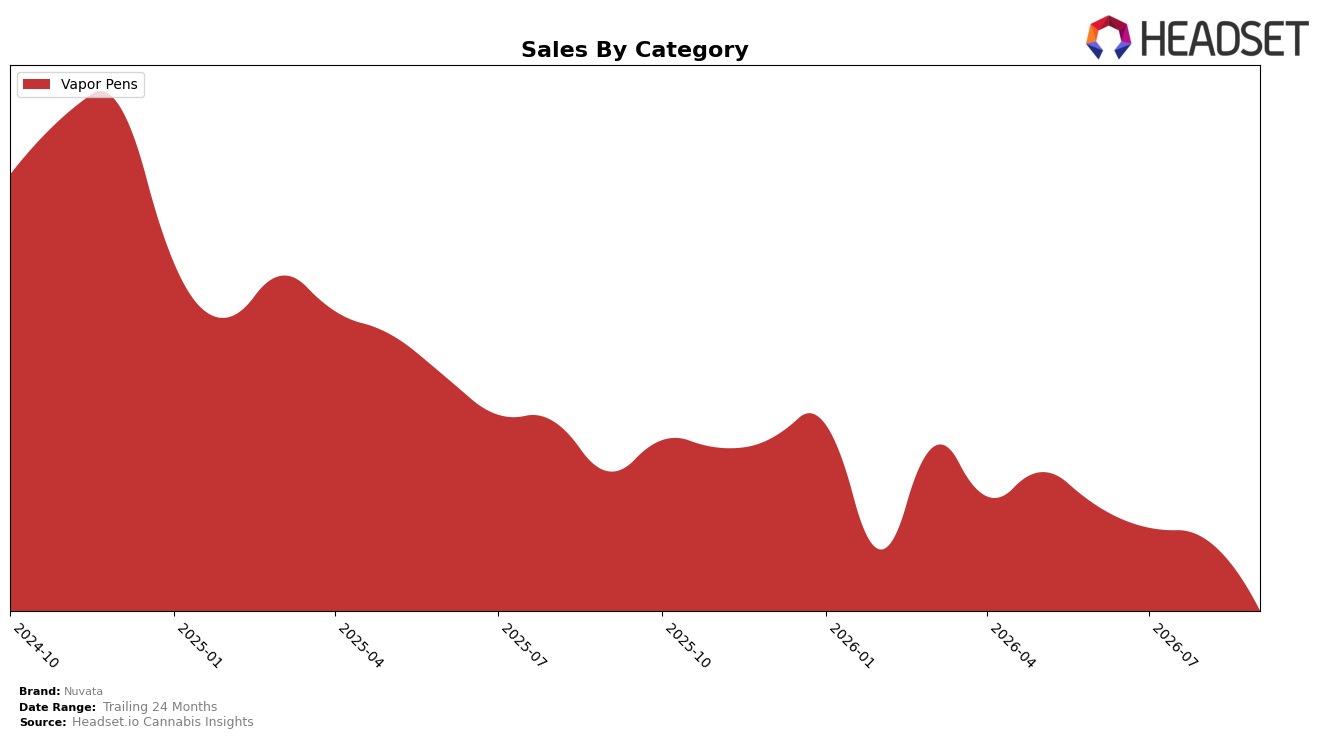
Nuvata operated as a single-category brand in September 2026, with Vapor Pens accounting for 100.0% of sales and an average price of $28.37. Within this focus, Vapor Pens declined 37.63% year over year and 23.78% month over month, while the overall brand also posted a 37.63% YoY contraction and a 23.78% MoM pullback, indicating no offset from adjacent formats and a direct exposure to category headwinds. The average price decreased 6.58% YoY alongside a state-category rank of 46 in Illinois, implying that discounting did not translate into relative share gains and that the category concentration is amplifying the impact of underlying demand volatility.
The combination of a 100.0% Vapor Pens mix and a 37.63% YoY contraction, paired with a 23.78% MoM drop in September 2026, suggests Nuvata’s positioning is tied tightly to a single demand curve where price reductions of 6.58% YoY are functioning defensively rather than expanding reach. Given a rank of 46 in Illinois and the absence of sales in other categories, the brand’s current stance implies limited insulation against further category swings and a need to recalibrate pack, potency, or flavor architecture within Vapor Pens to stabilize velocity rather than relying on broader portfolio diversification in the near term.
Competitive Landscape
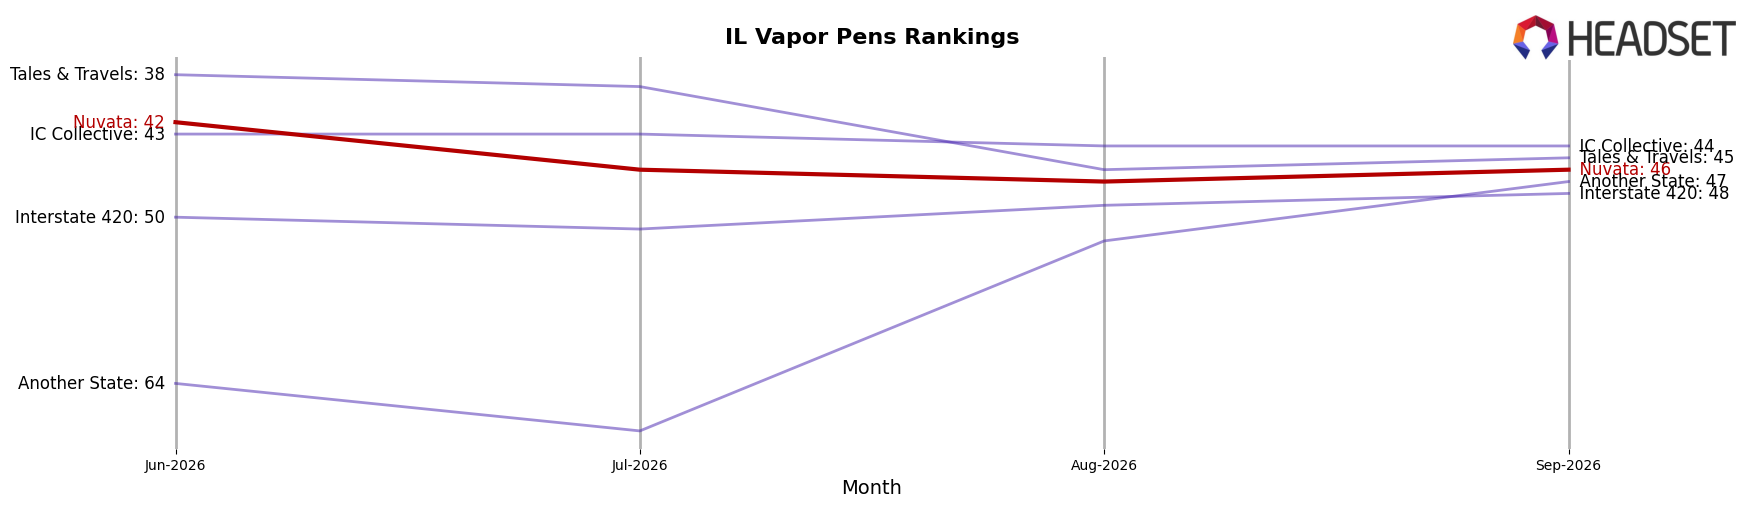
Nuvata sits at rank 46 in IL Vapor Pens in September 2026, down 13 positions year over year from rank 33, and 4 spots lower than June 2026’s rank 42; the brand is also far off its peak rank 19 achieved in December 2024, indicating a multi-quarter slide. Meanwhile, Fernway climbed from rank 13 to rank 3 with 308.8% YoY sales growth, and &Shine moved from rank 2 to rank 1 with 38.4% YoY growth, while Savvy fell from rank 3 to rank 5 alongside a -32.7% YoY decline, showing that the top tier is both consolidating and churning. The pattern implies Nuvata’s trajectory is toward the lower mid-pack unless it counters competitors’ upward mobility and volatility at the top with targeted share recovery.
Notable Products
CBD/THC 1:9 Tropical Mind Balance Distillate Disposable (1g) posted the steepest decline at -56.4% month over month and slid to rank 10, while CBD/THC 1:9 Lime Body Balance Distillate Disposable (0.5g) fell -34.9% at rank 6. In contrast, CBD/THC 1:9 Strawberry Full Mind Distillate Disposable (0.5g) rose +9.1% to rank 2 and CBD/THC 1:9 Wild Grape Full Body Distillate Disposable (0.5g) gained +7.5% at rank 1. The coexistence of sharp 1g pullbacks alongside modest 0.5g advances implies a consumer tilt toward smaller-format distillate devices over larger fills in September 2026.
Seven of the top ten are 1:9 distillate Vapor Pens, and 0.5g variants hold the top 2 ranks while three 1g SKUs declined between -30.8% and -56.4%. CBD/THC 1:9 Wild Grape Full Body Distillate Disposable (1g) dropped -43.1% to rank 7 as the 0.5g counterpart led the chart, and CBD/THC 1:9 Blueberry Body Dominant Distillate Disposable (1g) slipped -30.8% at rank 8. This concentration coupled with format divergence suggests Nuvata’s volume is consolidating in core 0.5g 1:9 profiles, prioritizing velocity over size in September 2026.
Top Selling Cannabis Brands






Data for this report comes from real-time sales reporting by participating cannabis retailers via their point-of-sale systems, which are linked up with Headset’s business intelligence software. Headset’s data is very reliable, as it comes digitally direct from our partner retailers. However, the potential does exist for misreporting in the instance of duplicates, incorrectly classified products, inaccurate entry of products into point-of-sale systems, or even simple human error at the point of purchase. Thus, there is a slight margin of error to consider. Brands listed on this page are ranked in the top twenty within the market and product category by total retail sales volume.

