Market Insights Snapshot
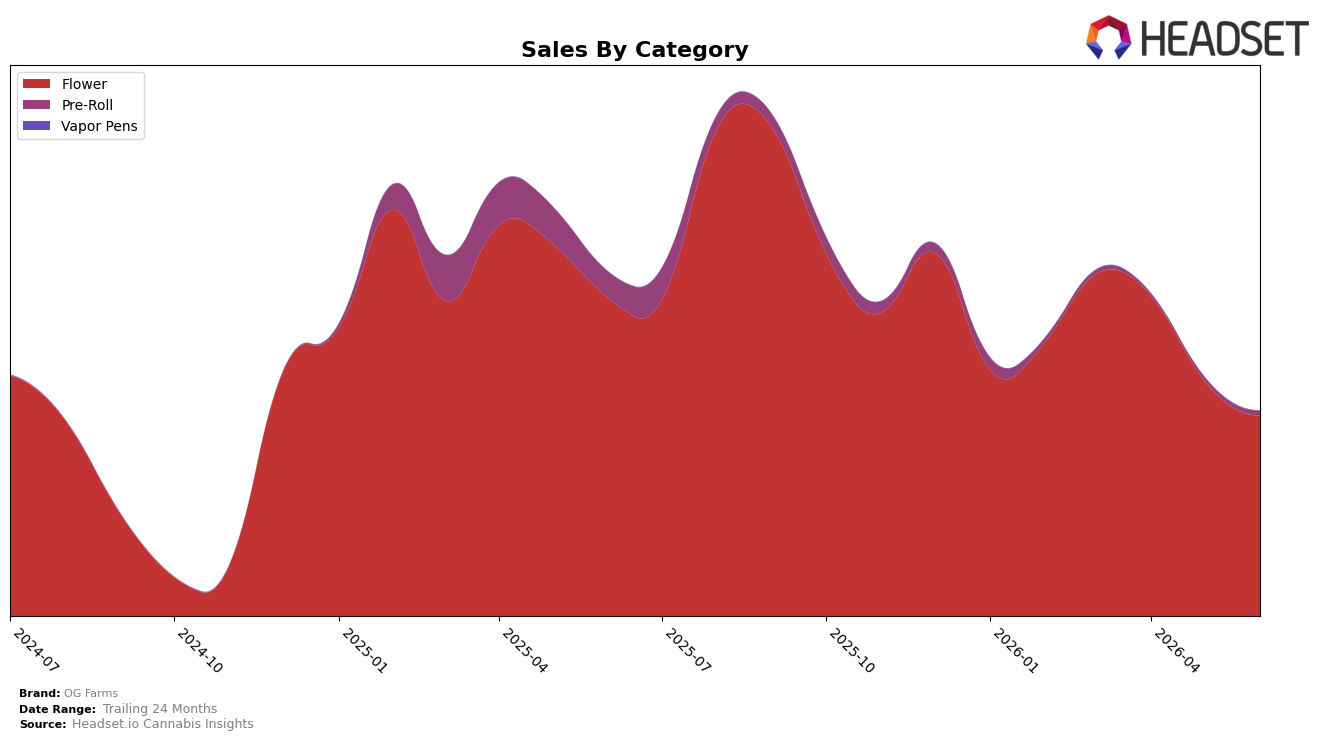
In June 2026, OG Farms derived 97.83% of sales from Flower while Pre-Roll accounted for 2.17%, placing the brand in a highly concentrated mix where the leading category fell 14.70% month over month and 36.94% year over year even as Pre-Roll rose 24.55% MoM but declined 82.90% YoY. With brand-level sales down 40.42% YoY and the average price up 23.74% YoY to $13.48, the mix is leaning into a category that is shrinking faster than the portfolio can diversify, implying that June 2026 performance was constrained by overexposure to Flower despite a short-term uptick in Pre-Roll.
Positioning-wise, OG Farms’ 97.83% dependence on Flower in June 2026 against a category MoM decline of 14.70% and YoY decline of 36.94% suggests the brand’s risk is tied to a single-category downturn, while the 24.55% MoM lift in Pre-Roll from a 2.17% base is too small to offset portfolio drag. Holding a Flower rank of 27 in Michigan alongside a 23.74% YoY increase in average price indicates the brand is trading pricing for share in a weakening core, implying that near-term defensibility requires either deeper price calibration in Flower or accelerated share building in adjacent formats to reduce volatility.
Competitive Landscape
OG Farms sits at rank #27 in MI Flower for June 2026, down 12 positions from #15 year over year, and 12 spots below its March 2026 rank of #15; against its peak of #9 in September 2025, that is an 18-place slide that coincides with peers consolidating at the top. In contrast, High Minded held #1 both year over year and in June 2026 despite a -13.7% YoY sales change, while Goodlyfe Farms climbed from #5 to #2 on +44.1% YoY growth and Mischief rose from #13 to #5 with +146.1% YoY growth, indicating that OG Farms’ drop from #15 to #27 is not just category headwinds but a relative share shift toward faster-rising competitors. The rank trajectory implies OG Farms is ceding visibility and shelf priority to competitors that are converting growth into rank gains, and without a reversal the brand risks drifting out of the top 30 where velocity and distribution typically thin.

Notable Products
Bop Gun (28g) posted the steepest decline in June 2026 at -43.8% MoM while still holding rank 1, which suggests reliance on legacy velocity even as unit pullback intensifies. In contrast, Grape Pie (28g) climbed 33.5% MoM to rank 3 and Candy Fumez (28g) gained 28.0% MoM at rank 2, indicating momentum is consolidating just below the top slot. With nine of the top ten SKUs concentrated in Flower and Bop Gun (Bulk) at rank 7, the mix points to a shift from a single flagship toward a tiered Flower portfolio where growth skews to mid-top ranks rather than the leader, implying pricing and promotion should pivot to support fast-rising followers rather than propping up a declining anchor.
Top Selling Cannabis Brands
Data for this report comes from real-time sales reporting by participating cannabis retailers via their point-of-sale systems, which are linked up with Headset’s business intelligence software. Headset’s data is very reliable, as it comes digitally direct from our partner retailers. However, the potential does exist for misreporting in the instance of duplicates, incorrectly classified products, inaccurate entry of products into point-of-sale systems, or even simple human error at the point of purchase. Thus, there is a slight margin of error to consider. Brands listed on this page are ranked in the top twenty within the market and product category by total retail sales volume.

