.svg)
Sep-2026
Sales
Trend
6-Month
Product Count
SKUs
Avg Price
YoY Sales Change
YoY Price Change


Where to Buy
Local Grove is stocked at 197 licensed dispensaries across Michigan and Oklahoma, 195 of them in Michigan, with the deepest coverage in Detroit, New Buffalo, Monroe, Grand Rapids, and Ann Arbor. Search by ZIP code or city below to find the closest one, or filter by product type if you are after a specific format.
Market Insights Snapshot
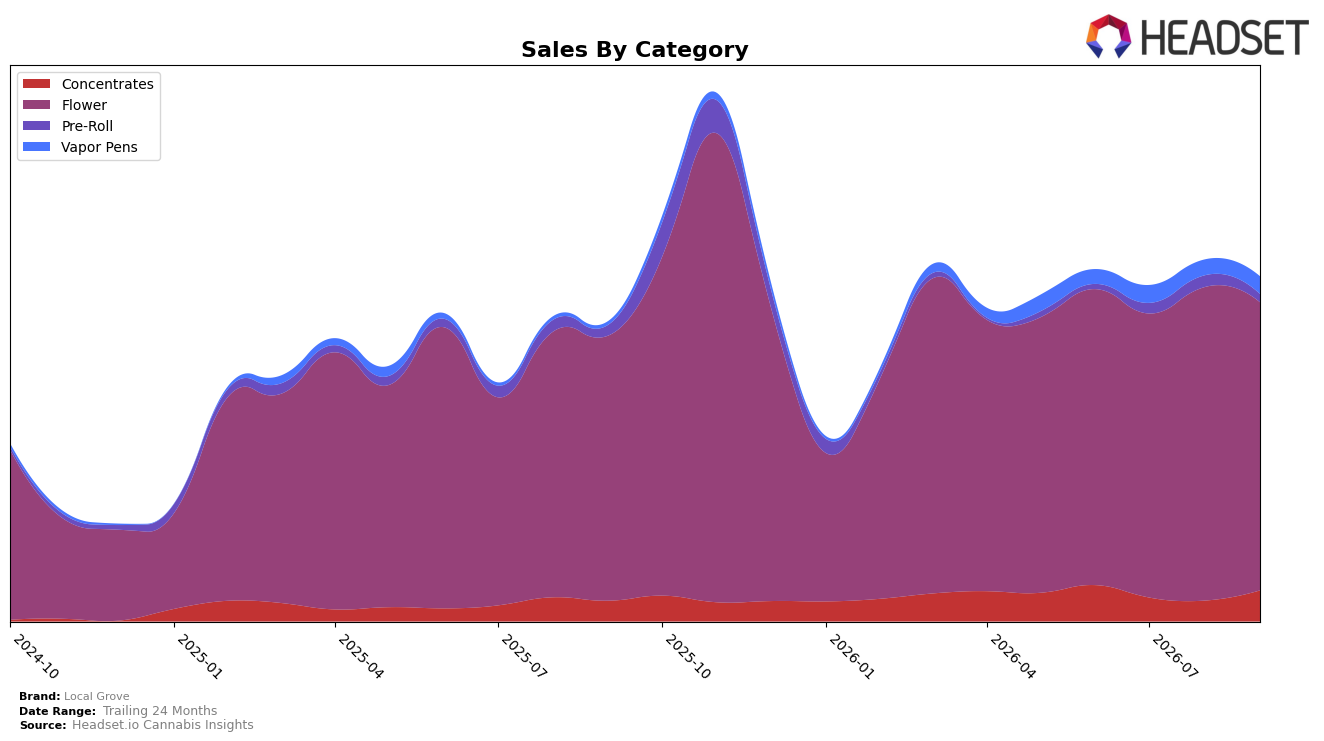
Local Grove concentrated 82.73% of September 2026 sales in Flower, where sales grew 8.65% year over year but fell 8.07% month over month, while the brand’s average price rose 16.13% YoY to $28.96. Concentrates expanded to 9.22% share with 47.06% YoY growth and a 46.36% MoM jump, and Vapor Pens reached 5.37% share on 286.95% YoY and 10.81% MoM gains; meanwhile, Pre-Roll slid to 2.68% share with a 20.87% YoY decline and a 26.88% MoM drop. In Michigan Flower, the brand sat at rank 19 in September 2026, implying a reliance on a high-share core that is softening sequentially even as adjacent inhalables accelerate.
The mix shift toward Concentrates (+46.36% MoM, +47.06% YoY) and Vapor Pens (+10.81% MoM, +286.95% YoY) while Flower contracts MoM (-8.07%) and Pre-Roll retrenches (-26.88% MoM) suggests the brand is trading depth in its core for incremental reach in higher-velocity niches. With Flower still at 82.73% share and rank 19 in Michigan, the pattern implies near-term headroom comes from sustaining double-digit percentage gains in Concentrates and Vapor Pens to offset Flower volatility and to improve positioning without overexposing the portfolio to a single category’s month-to-month swings.
Competitive Landscape
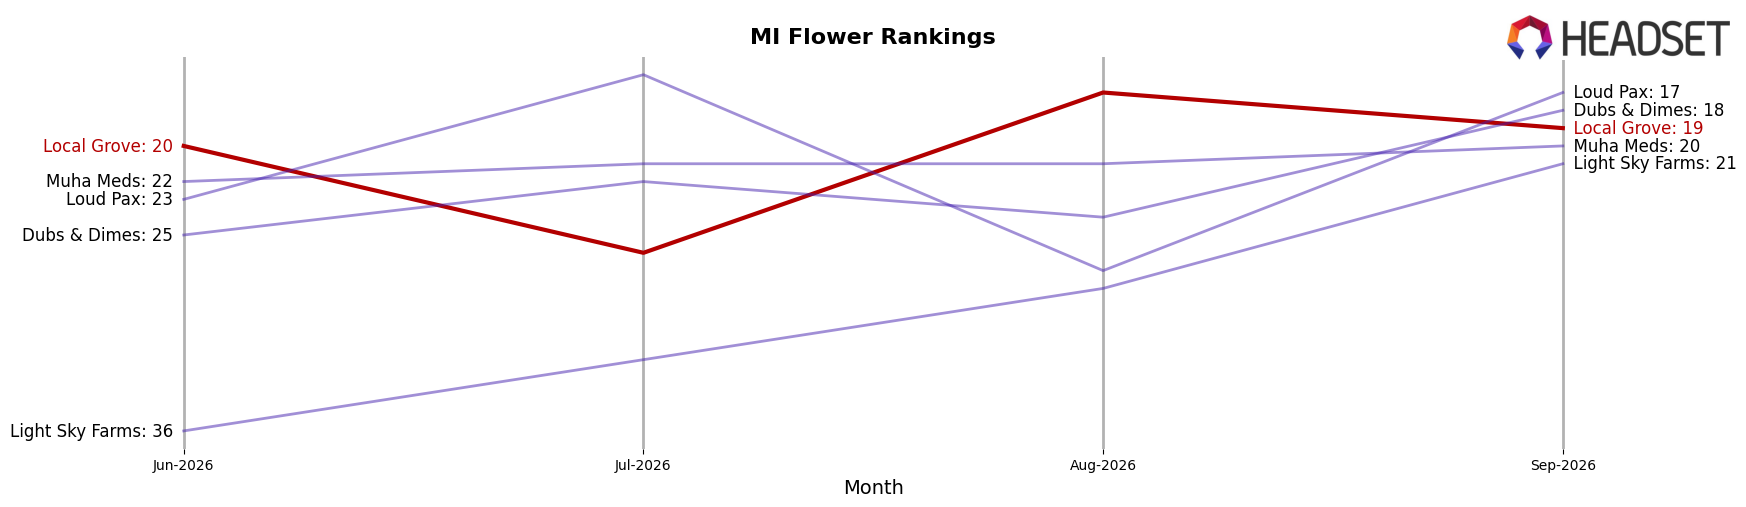
Local Grove sits at rank #19 in MI Flower in September 2026, improving 8 positions from #27 year over year, but slipping 1 spot from #20 in June 2026; compared with competitors, High Minded held rank #1 year over year with a -3.3% sales change while Play Cannabis advanced from #7 to #2 on +33.3% YoY sales, and NOBO jumped from #19 to #4 with +188.3% YoY growth, indicating that Local Grove’s modest ascent and recent dip from a peak of #13 in November 2025 implies mid-pack consolidation rather than a breakout trajectory unless momentum accelerates.
Notable Products
Cherry Cola (Bulk) posted the steepest movement in September 2026 with a -53.6% month-over-month decline while holding rank 3, contrasting with Count Chunkula (Bulk) up 70.5% MoM at rank 4. Gogurtz (1g) slipped 28.9% MoM yet sits at rank 2, and Glow Pop (Bulk) fell 16.6% MoM at rank 9, indicating volatility clustered in mid-to-upper ranks. With eight of the top ten SKUs in Flower and only one Pre-Roll in rank 10, the mix points to a Flower-heavy portfolio where rapid shifts in a few bulk SKUs can swing category momentum and push Local Grove toward tighter assortment control over bulk formats.
Top Selling Cannabis Brands






Data for this report comes from real-time sales reporting by participating cannabis retailers via their point-of-sale systems, which are linked up with Headset’s business intelligence software. Headset’s data is very reliable, as it comes digitally direct from our partner retailers. However, the potential does exist for misreporting in the instance of duplicates, incorrectly classified products, inaccurate entry of products into point-of-sale systems, or even simple human error at the point of purchase. Thus, there is a slight margin of error to consider. Brands listed on this page are ranked in the top twenty within the market and product category by total retail sales volume.

