.svg)

Aug-2026
Sales
Trend
6-Month
Product Count
SKUs
Avg Price
YoY Sales Change
YoY Price Change


Where to Buy
Gezoont is stocked at 13 licensed dispensaries across New York, with the deepest coverage in Airmont, Albany, Cortlandt Manor, Farmingdale, and Hudson. Search by ZIP code or city below to find the closest one, or filter by product type if you are after a specific format.
Market Insights Snapshot
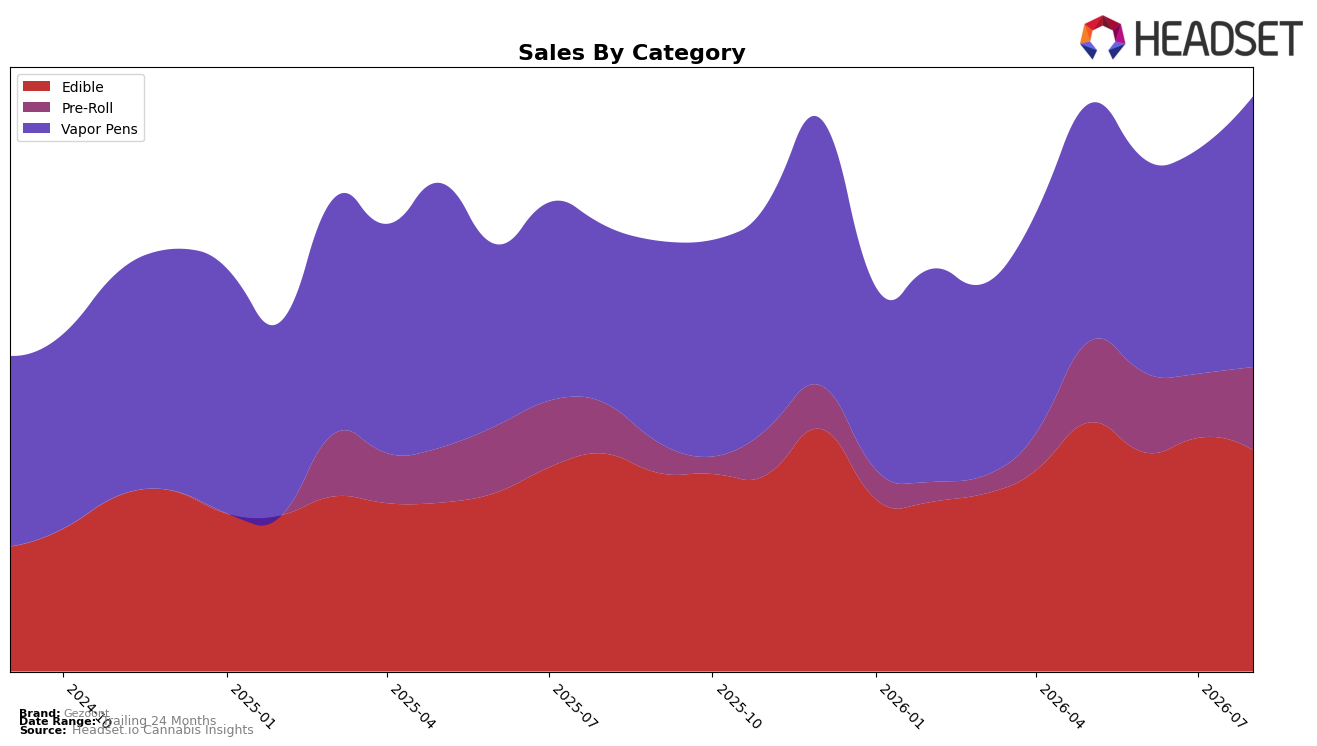
In August 2026, Gezoont’s mix tilted further toward Vapor Pens at 47.09% share with year-over-year growth of 52.59% and month-over-month growth of 20.61%, while Pre-Roll climbed to 14.44% share on 63.73% YoY and 29.88% MoM, and Edible contracted to 38.47% share with 1.51% YoY and -5.28% MoM. Average prices moved in opposite directions across the mix, with Vapor Pens at $30.39 and Edible at $17.54, coinciding with a brand-level average price decline of 9.82% YoY and overall sales growth of 28.91% YoY, implying a volume-led shift where higher-velocity inhalables offset softer Edible momentum.
The category tilt implies Gezoont is consolidating around faster-cycling inhalables, with Vapor Pens gaining share and Pre-Roll expanding more quickly than Edible, while the brand’s rank of 62 in Vapor Pens in New York sets a clear target for incremental distribution and price-pack architecture. The combination of 20.61% MoM growth in Vapor Pens and 29.88% MoM in Pre-Roll against a -5.28% MoM in Edible suggests merchandising and promotional weight should migrate toward inhalables, and the 52.59% YoY in Vapor Pens alongside 63.73% YoY in Pre-Roll indicates that sustaining price elasticity at or below the current $30.39/$33.03 corridor can convert share gains into durable positioning.
Competitive Landscape
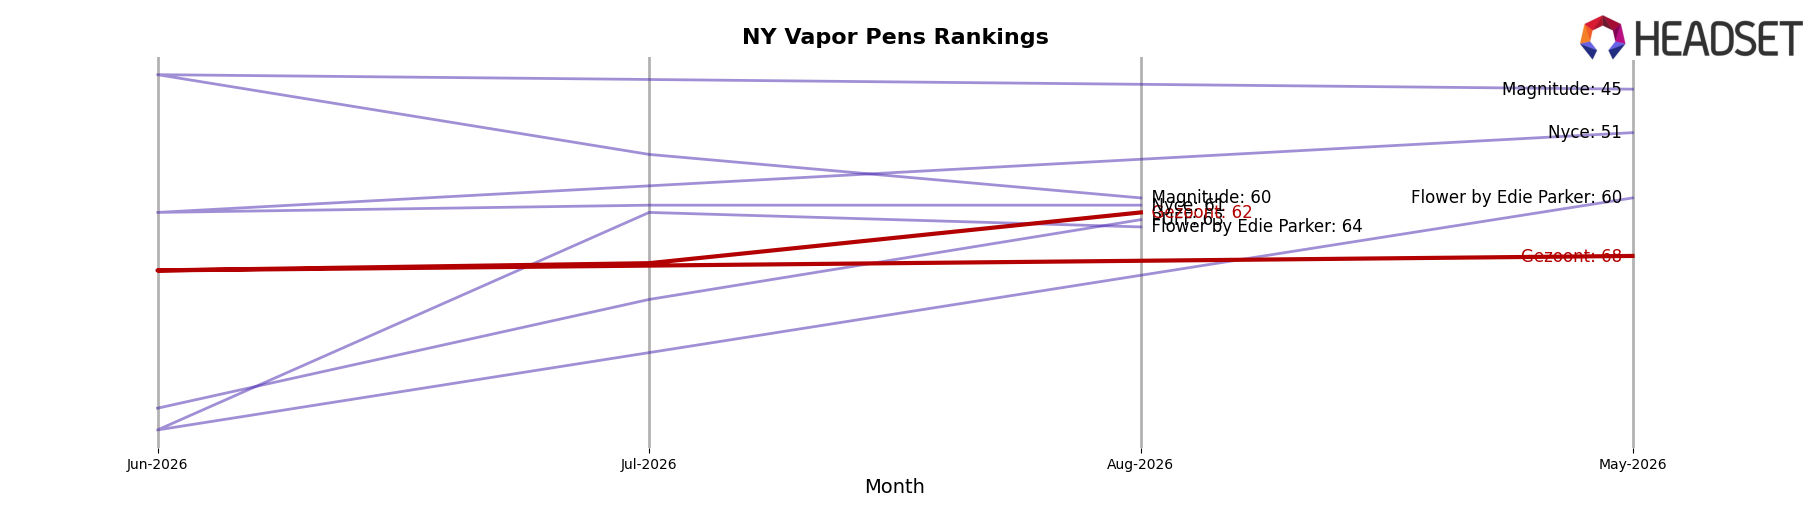
Gezoont sits at rank 62 in NY Vapor Pens in August 2026, improving 2 positions year over year from rank 64 and rising 6 positions versus May 2026 when it was rank 68; however, it remains 20 places below its peak rank of 42 reached in January 2025. Competitive movement is sharper at the top: Fernway climbed from rank 3 to rank 1 with a 36.3% year-over-year sales increase, while Jetty Extracts surged from rank 26 to rank 5 on 230.1% year-over-year growth; by contrast, Jaunty slipped from rank 1 to rank 2 alongside a 24.5% sales decline. The pattern implies Gezoont’s modest rank gains are being outpaced by faster movers at the top, so sustaining improvement from rank 68 to 62 will require tactics that convert incremental share into double-digit rank advances in a market where leaders can shift 20-plus ranks within a year.
Notable Products
Strawberry Pomegrate Gummies 10-Pack (100mg) posted the steepest decline at -13.0% MoM while slipping to rank 3, and Citrus Crush Gummies 10-Pack (100mg) fell -14.5% MoM at rank 8, indicating flavor fatigue within core Edibles. In contrast, Gorilla Glue Live Resin Disposable (0.5g) jumped 33.4% MoM to rank 6 and Ice Cream Cake Live Resin Disposable (0.5g) rose 29.5% MoM to rank 9, while Blood Orange Diesel Live Resin Disposable (0.5g) advanced 26.5% MoM at rank 2, signaling momentum in Vapor Pens. Five of the top ten are Edible SKUs, but three Vapor Pens sit in the top 10 with 26–33% MoM gains, and the top Edible, Bangin Blueberry Gummies 10-Pack (100mg), still edged down -4.3% at rank 1 with $20,516 in August 2026 sales, suggesting the mix is tilting toward inhalables despite Edibles breadth. The pattern implies Gezoont is migrating demand from mixed Edibles toward higher-velocity Live Resin Disposables, pointing to a near-term portfolio emphasis on Vapor Pens for share capture.
Top Selling Cannabis Brands






Data for this report comes from real-time sales reporting by participating cannabis retailers via their point-of-sale systems, which are linked up with Headset’s business intelligence software. Headset’s data is very reliable, as it comes digitally direct from our partner retailers. However, the potential does exist for misreporting in the instance of duplicates, incorrectly classified products, inaccurate entry of products into point-of-sale systems, or even simple human error at the point of purchase. Thus, there is a slight margin of error to consider. Brands listed on this page are ranked in the top twenty within the market and product category by total retail sales volume.

