Jun-2026
Sales
Trend
6-Month
Product Count
SKUs
Avg Price
YoY Sales Change
YoY Price Change
Market Insights Snapshot
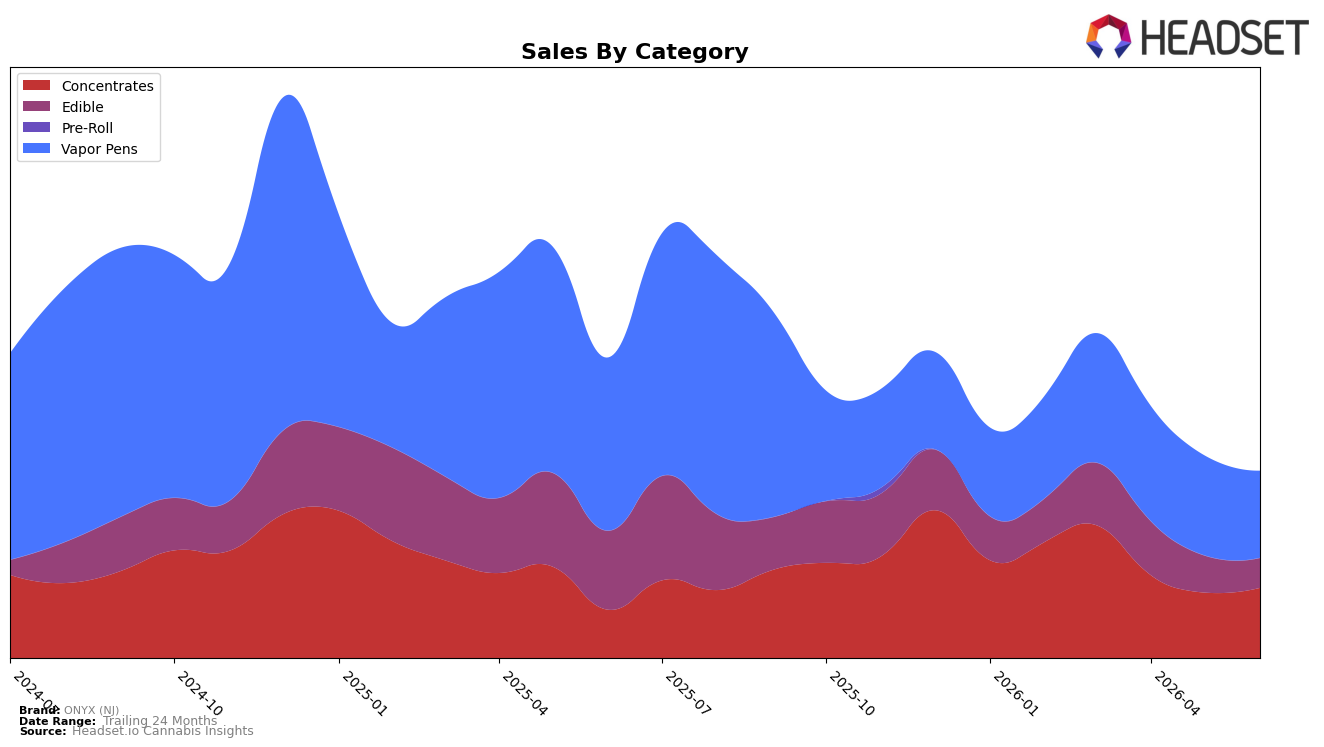
ONYX (NJ) concentrated 46.53% of June 2026 sales in Vapor Pens, 37.64% in Concentrates, and 15.83% in Edible, while overall brand sales fell 37.80% year over year and average price rose 10.04%. Vapor Pens declined 49.80% YoY and 12.92% MoM with an average price of $46.58, whereas Concentrates increased 45.27% YoY and 7.20% MoM at an average price of $61.48. Edible contracted 62.45% YoY and 19.33% MoM at an average price of $19.85, and the brand ranked 42 in Vapor Pens within New Jersey. The pattern implies the category mix is pivoting away from Vapor Pens toward Concentrates as a volume stabilizer despite higher ticket sizes, while Edible weakness intensifies overall contraction.
Given a 42 rank in New Jersey Vapor Pens and a 49.80% YoY drop in that category versus a 45.27% YoY rise in Concentrates, ONYX (NJ) is migrating toward a potency-led, higher-price positioning anchored in Concentrates rather than inhalable breadth. The 12.92% MoM decline in Vapor Pens and 19.33% MoM decline in Edible against a 7.20% MoM uptick in Concentrates indicate near-term demand concentrates in fewer, higher-value SKUs, suggesting the brand’s competitive footing will strengthen where premium extraction formats offset volume softness in legacy formats.
Competitive Landscape
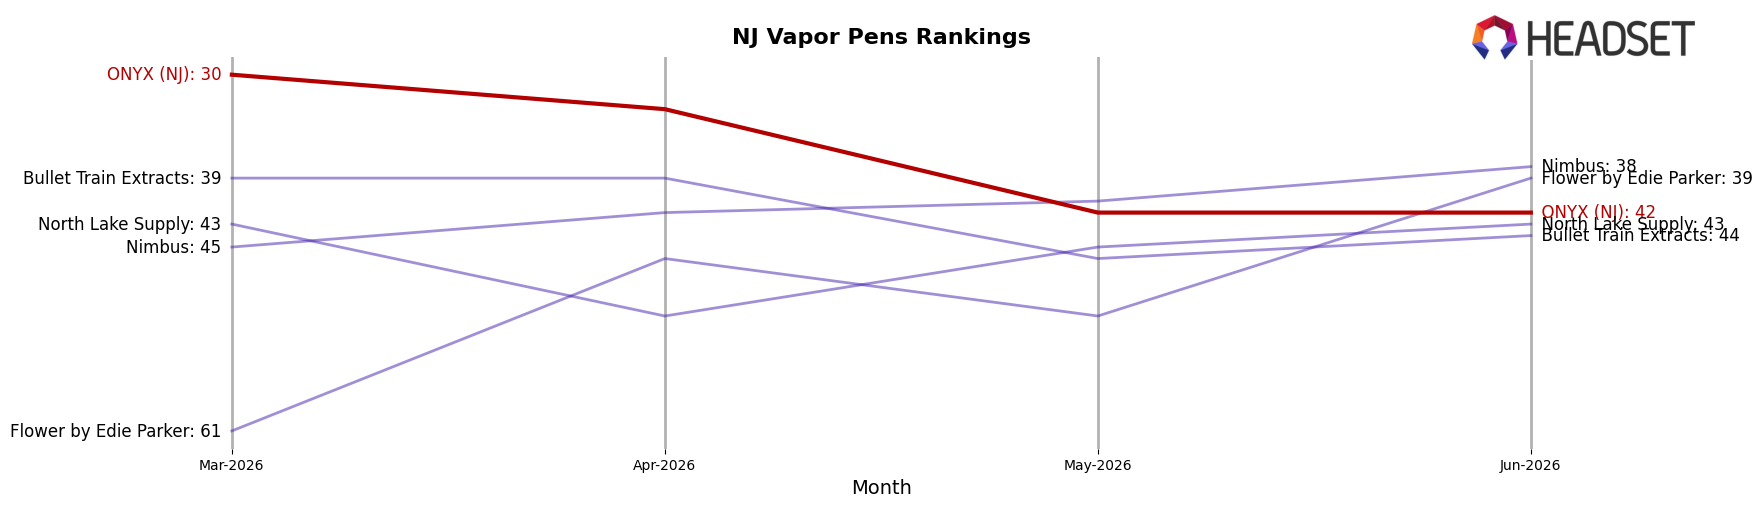
ONYX (NJ) sits at rank #42 in New Jersey Vapor Pens in June 2026, down 16 positions year over year from #26, and 12 spots below its March 2026 mark of #30; this contrasts with Select holding #1 year over year and in June 2026 while posting a -8.6% sales change, and Fernway staying at #2 year over year with a 10.7% sales increase. Despite a historical peak of #15 in September 2024, ONYX (NJ) now trails Legend at #3 with 27.2% sales growth and RYTHM at #5 with 26.0% growth, indicating that ONYX (NJ)’s downward rank shift and three-month decline suggest share is consolidating upward among leaders rather than diffusing to mid-pack brands.
Notable Products
Guava Rising Live Resin Liquid Diamonds HTE Cartridge (0.5g) posted the fastest month-over-month move at +49.9% to reach rank 3, while ONYX (NJ) held the category lead with Peach Ringz Live Resin Distillate Cartridge (1g) at rank 1 despite no reported month-over-month figure; the contrast implies June 2026 momentum centered on mid-tier Vapor Pens climbing into the top cluster. Blackberry Octane Cold Cure Live Rosin (1g) advanced +36.8% to rank 2, whereas One Peach Live Rosin Gummies 10-Pack (100mg) declined -5.9% at rank 4, and with four of the top ten in Vapor Pens, the share of placement skews toward inhalables over edibles; this pattern implies ONYX (NJ) is consolidating assortment depth in Vapor Pens to anchor traffic while trimming reliance on Edibles. Average rank among the three named SKUs sits at 2.0 versus an overall top-10 median of 5.5, and only one Edible sits within the top five, indicating price and potency trade-ups are concentrating spend in cartridges rather than multi-pack gummies; this suggests the commercial direction favors higher-velocity pen formats and solvent-forward concentrate tie-ins over confection expansion.
Top Selling Cannabis Brands
Data for this report comes from real-time sales reporting by participating cannabis retailers via their point-of-sale systems, which are linked up with Headset’s business intelligence software. Headset’s data is very reliable, as it comes digitally direct from our partner retailers. However, the potential does exist for misreporting in the instance of duplicates, incorrectly classified products, inaccurate entry of products into point-of-sale systems, or even simple human error at the point of purchase. Thus, there is a slight margin of error to consider. Brands listed on this page are ranked in the top twenty within the market and product category by total retail sales volume.

