May-2026
Sales
Trend
6-Month
Product Count
SKUs
Avg Price
YoY Sales Change
YoY Price Change
Market Insights Snapshot
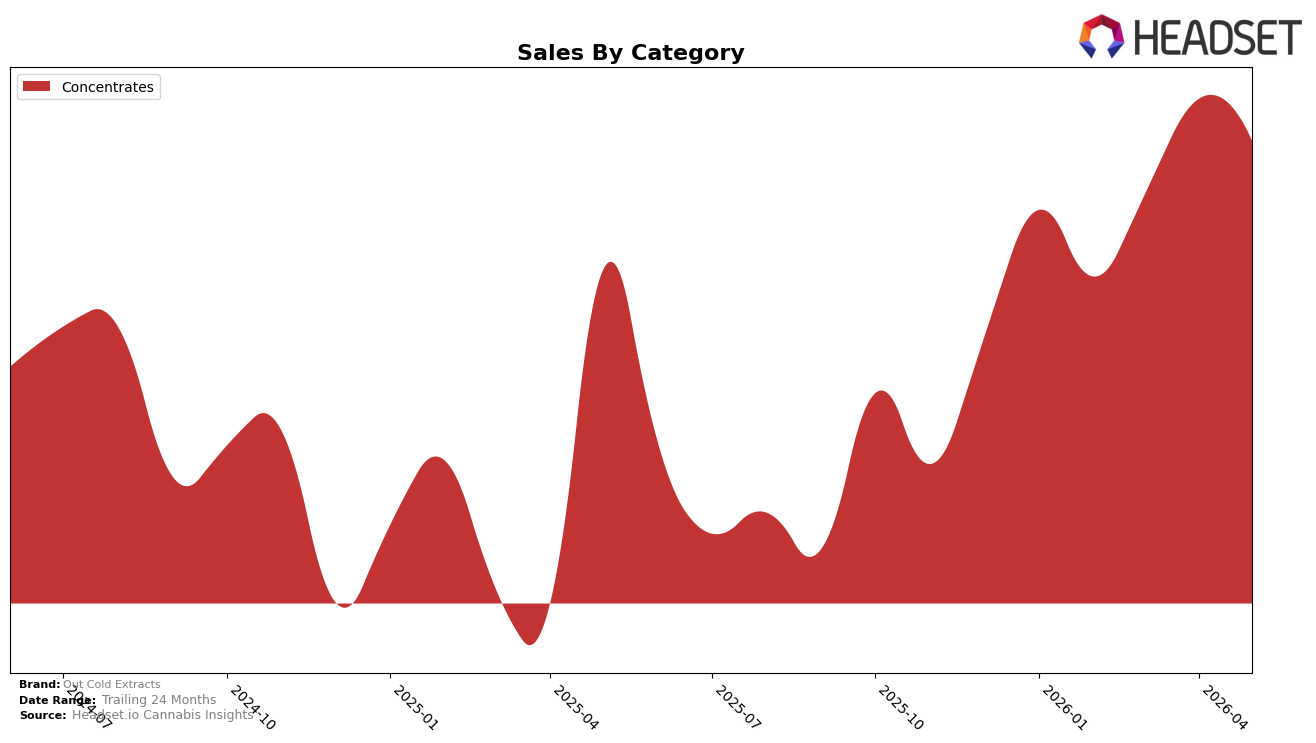
Out Cold Extracts operated exclusively in Concentrates with a 100.0% category share in May 2026, while year-over-year sales in that category rose 26.44% and month-over-month sales dipped 6.33%. The average price declined 8.07% year over year to $37.07, aligning with a 26.44% YoY sales lift and a 6.33% MoM pullback, and the brand held rank 30 in Oregon Concentrates. The pattern implies a single-category reliance where YoY demand is expanding even as short-cycle softness and lower pricing pressure the monthly trend.
With Concentrates at 100.0% of mix and a rank of 30 in Oregon, the 8.07% YoY price reduction paired with 26.44% YoY sales growth signals elasticity-driven volume gains but limited insulation against a 6.33% MoM contraction. The combination of rank 30 and sole-category exposure suggests a positioning centered on price-responsive Concentrates buyers rather than diversified cross-category capture, implying that sustaining share will depend on managing price and potency tiers more than channeling growth through adjacent formats.
Competitive Landscape
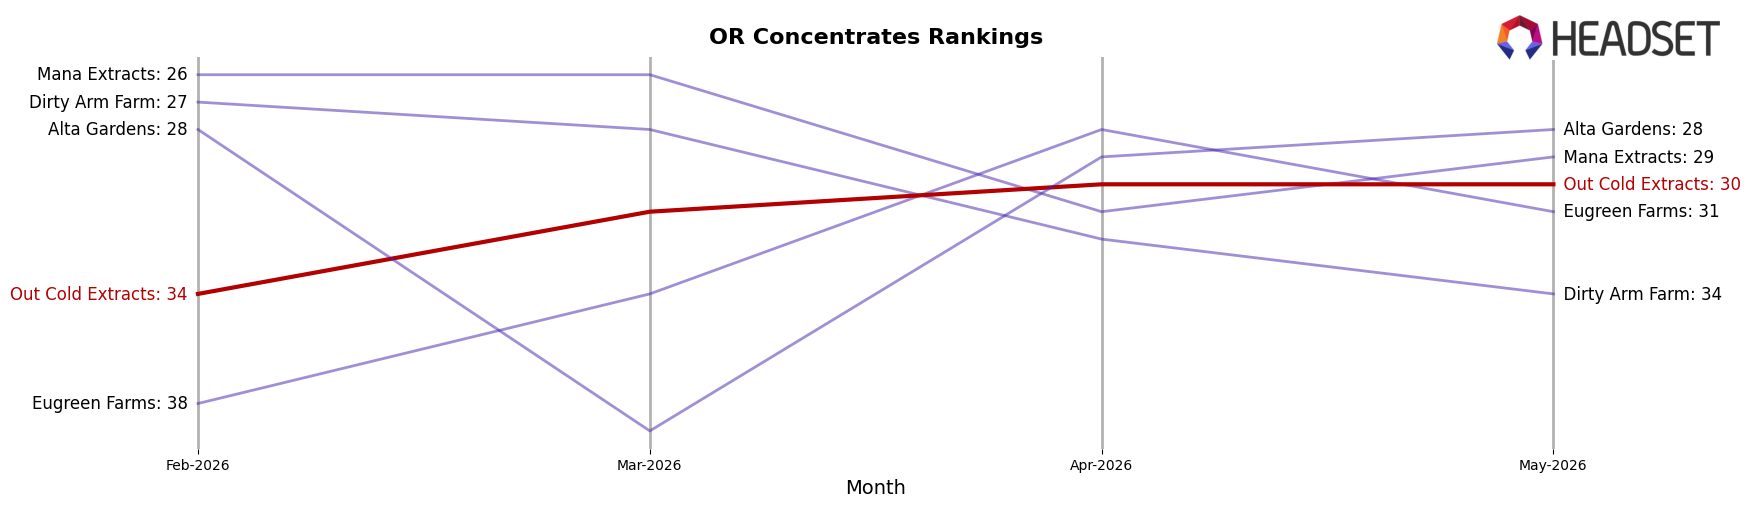
Out Cold Extracts holds rank #30 in OR Concentrates in May 2026, a 2-position improvement from #32 year over year, and a 4-position climb from #34 three months ago, while still trailing its January 2026 peak of #29 by 1 slot; in contrast, Altered Alchemy maintained #1 with a 22.3% YoY sales increase and Oregrown advanced from #3 to #2 alongside a 20.1% YoY lift, whereas Red Eye Extracts (OR) slipped from #2 to #4 amid a 38.5% YoY decline; this mix of incremental rank gains amid leaders consolidating share and a top-four contraction implies Out Cold Extracts’ modest upward trajectory is driven by stability rather than breakout momentum.
Notable Products
Grape Pie Wedding Crasher Rosin Badder (1g) posted the headline move in May 2026 with a 231.98% month-over-month surge and entered the top five at rank 5, while GMO Rosin Badder (1g) fell 31.63% and slid to rank 7. Peach Delish Live Rosin Badder (2g) advanced 56.47% month over month to rank 2, and GMO Live Rosin (2g) held rank 1 with a 23.01% lift, indicating demand skewing toward higher-visibility SKUs at the top of the chart. Eight of the top ten are Concentrates, and two SKUs in the top three carry Live Rosin formats, pointing to a mix concentrating around solventless value tiers rather than breadth across categories. The pattern implies Out Cold Extracts is consolidating around a few fast-moving solventless Concentrates with selective 1g experimentation, prioritizing velocity over portfolio dispersion.
Top Selling Cannabis Brands
Data for this report comes from real-time sales reporting by participating cannabis retailers via their point-of-sale systems, which are linked up with Headset’s business intelligence software. Headset’s data is very reliable, as it comes digitally direct from our partner retailers. However, the potential does exist for misreporting in the instance of duplicates, incorrectly classified products, inaccurate entry of products into point-of-sale systems, or even simple human error at the point of purchase. Thus, there is a slight margin of error to consider. Brands listed on this page are ranked in the top twenty within the market and product category by total retail sales volume.

